Multi Objectives Reactive Dispatch Optimization of an Electrical Network
Houssem BEN ARIBIA, Hsan HADJ ABDALLAH
National school of Engineering, Sfax, BP W, 3038, Tunisia, Tel.:74 274 088
houssem_ben_aribia@yahoo.fr, hsan.haj@enis.rnu.tn
Abstract
One of the problems of the responsible of energy production and distribution is the maintaining of an appropriate voltage profile.
This task can be done by the minimization of the active losses in the transportation and transmission lines by implantation of reactive power sources to the load buses. In addition to the minimization of the active losses, other criteria can be considered as the compensation devices cost and the voltage deviation. The problem to solve is multi criteria under constraints related to the voltages, the reactive productions, the compensation devices cost and the active losses. Its resolution requires the use of the advanced algorithms.
In this paper, we propose an approach based on the evolutionary algorithms (AE) to solve this problem multi criterion. It is about the SPEA2 method (Improving Strength Pareto Evolutionary Algorithm).
Keywords
Electrical network, Reactive dispatch, Multi objectives optimization, Evolutionary algorithms, Compensation devices cost, Voltage deviation, Active losses.
Introduction
Among the most important problems in the energy production and transportation systems is the maintenance of a voltage profile with an optimal operating and the security of the system.
An appropriate voltage profile can be maintained while minimizing three objective functions related to the total transmission active losses, the compensation devices cost and the voltage deviation of the load buses.
Different methods have been presented in the literature to solve the dispatch problems. Among these methods one can mention two families:
§ The first based on the classic methods as the non linear programming technique [10], the weights method [11] and the ε-constraints method [12].
§ The second based on the evolutionary techniques [1-4] as the NPGA method (Niched Pareto Genetic Algorithm) [5-6], NSGA (Non dominated Sorting Genetic Algorithm) [7], SPEA (Strength Pareto Evolutionary Algorithm) [8] and SPEA2 (Improving Strength Pareto Evolutionary Algorithm) [9].
The classic methods present some inconveniences as the non safety of convergence, the long time of execution, the algorithmic complexity and the generation of a weak number of non dominated solutions. Because of these inconveniences, the evolutionary algorithms took a bigger luck, thanks to their faculty to exploit vast spaces of research and don't require a pre recognition of the problem.
In this paper, the problem is formulated by three objective functions. The evolutionary optimization method used is the SPEA2. The simulations are made on the IEEE test network, 10 buses, 5 thermal generators and 13 lines.
Problem formulation
The resolution of the multi objectives problem of the optimal reactive dispatch, consist in minimizing three objective functions that represent the compensation devices cost, the transmission losses and the voltage deviation, under some constraints.
Compensation devices cost
The compensation devices cost function is formed by the fixed installation cost and the purchase cost.
This function is considered as a linear function [13-17]:
|
|
(1) |
with:
Cfi : fixed installation cost of the reactive power sources at the ith bus ($).
Cci : cost by MVAR of the compensation devices at the ith bus ($/MVAR).
Qci : compensation at the ith bus (MVAR).
Nc : number of possible bus for the installation of the compensation devices.
Total transmission active losses
The total losses in the transmission lines [18-20] are given by the following function:
|
|
(2) |
with:
![]() and
and ![]() are the size and the argument of the element (i,j) of the
nodal admittance matrix.
are the size and the argument of the element (i,j) of the
nodal admittance matrix.
Vi : voltage at the ith bus.
Vj: voltage at the jth bus.
N : number of buses in the electric network.
Voltage deviation
The voltage deviation at the ith bus is represented by the following function [21-22]:
|
|
(3) |
Problem constraints
Voltage and the reactive production at the load buses are restricted by upper and lower limits:
|
|
(4) |
|
|
(5) |
The compensation devices cost is limited by the maximum amount available for investment F1m:
|
F1 ≤ F1m |
(6) |
The total transmission active losses are positive:
|
|
(7) |
Multi objectives optimization
Principle of multi objectives optimization
In general, a multi objectives optimization problem is formulated as follows:
|
|
(8) |

with:
![]() : number of
objectives.
: number of
objectives.
![]() : numbers of
equality and inequality constraints, respectively.
: numbers of
equality and inequality constraints, respectively.
![]() : decision
vector.
: decision
vector.
Any two solutions x1 and x2 can have one of two possibilities: one covers or dominates the other or none dominates the other.
In a minimization problem, without loss of generality, a solution x1 dominates x2 if the following two conditions are satisfied:
|
|
(9) |

Xf is
the set of feasible solutions, i.e. ![]() .
.
where g(x) = (g1(x), g2(x), …, gM(x))T and h(x) = (h1(x), h2(x), …, hK(x))T.
A decision vector ![]() is non-dominated with respect to a set
is non-dominated with respect to a set ![]() , if is only if:
, if is only if:
|
|
(10) |
The set of non-dominated decision vectors is known as the Pareto optimal set, while the corresponding set of objective vectors constitutes the Pareto optimal front.
SPEA2 method (Improving Strength Pareto Evolutionary Algorithm)
The SPEA2 method is an improved version of the SPEA [9]. It defers of its predecessor in several aspects:
§ The archive size P' is fixed.
§
The calculation of the performance is refined more to the sense
that it holds more counts the density of the solutions. The Si value
is calculated for all solution![]() .
.
§ Only the archive members participate to reproduction.
§ A truncation method is used to control the archive size P'.
The SPEA2 method is defined by the following stages:
Input:
N (population size)
N’ (archive size)
T (maximum number of generations)
Output:
A (non dominated set)
Algorithm:
Step 1: Initialization: generate an initial population ![]() and create
an empty archive
and create
an empty archive ![]() = {}.
= {}.
Step 2: Fitness assignment: calculate fitness values of individuals in Pt and Pt'.
§
![]()
§
![]()
§
Calculate the distances in the objectives space between every
individual i and all others individuals![]() , and stocked them in a list.
, and stocked them in a list.
§ Sorting the list in increasing order. The kth element gives the distance sought, denoted as σi(k), k = ÖN + N'.
§ D(I) = 1/(σi(k) + 2)
§ F(i) = R(i) + D(i)
Step 3: Environmental Selection: copy all non dominated individuals in Pt and Pt' to P't+1.
§
![]()
§
If ![]() better dominated individuals to the
sense of F are copied in P't+1.
better dominated individuals to the
sense of F are copied in P't+1.
§
If ![]() : reduce P't+1 by
means of the truncation operator; at each iteration that individual i is
chosen for removal for which
: reduce P't+1 by
means of the truncation operator; at each iteration that individual i is
chosen for removal for which ![]() for all
for all ![]()

Step 4: A tournament selection is applied to fill the mating pool.
Step 5: Apply recombination and mutation operators to the mating pool.
Numeric simulations and commentaries
In this part we present the results of the reactive dispatch (RD) problem. The simulations have been tested on the IEEE network (10 buses) [23].
Presentation of the studied network
The used network is an IEEE test network, including 10 buses, 5 thermal generators and 13 lines [23]. The network structure is shown in figure 1.
Figure 1: Structure of the IEEE 10 buses network modified
Table 1. Data lines
|
Line Number |
Link |
Impedance (p.u.) |
|
1 |
1-2 |
0.02 + j0.08 |
|
2 |
1-6 |
0.06 + j0.24 |
|
3 |
1-9 |
0.04 + j0.16 |
|
4 |
2-3 |
0.06 + j0.24 |
|
5 |
2-6 |
0.06 + j0.24 |
|
6 |
3-7 |
0.06 + j0.24 |
|
7 |
4-7 |
0.04 + j0.16 |
|
8 |
4-8 |
0.06 + j0.24 |
|
9 |
5-6 |
0.04 + j0.16 |
|
10 |
5-10 |
0.06 + j0.24 |
|
11 |
6-9 |
0.01+ j0.04 |
|
12 |
8-10 |
0.04 + j0.16 |
|
13 |
8-10 |
0.08 + j0.32 |
Table 2. Data buses
|
Bus |
Types |
Active power loaded (p.u) |
Reactive power loaded (p.u) |
Voltages (p.u) |
|
1 |
P-Q |
0.20 |
0.097 |
- |
|
2 |
P-Q |
0.30 |
0.145 |
- |
|
3 |
P-Q |
0.20 |
0.097 |
- |
|
4 |
P-Q |
0.30 |
0.145 |
- |
|
5 |
P-Q |
0.20 |
0.097 |
- |
|
6 |
P-V |
0.30 |
0.145 |
1.00 |
|
7 |
P-V |
0.15 |
0.0726 |
1.00 |
|
8 |
P-V |
0.20 |
0.097 |
1.00 |
|
9 |
P-V |
0.20 |
0.097 |
1.00 |
|
10 |
Slack |
0.20 |
0.097 |
1.05 |
Table 3. Coefficients of the compensation devices cost and voltage values wanted
|
Bus |
Cfi ($) |
Cgi ($/MVAR) |
|
|
1 |
1771.59 |
5314.8 |
1 |
|
2 |
1771.59 |
5314.8 |
1 |
|
3 |
1771.59 |
5314.8 |
1 |
|
4 |
1771.59 |
5314.8 |
1 |
|
5 |
1771.59 |
5314.8 |
1 |
Simulation results
Mono objective optimization
The evolution of the mono objective optimization during the iterations of the active losses and the voltage deviation is shown in figures 2.
|
|
|
|
Figure 2. Convergence of the power losses and deviation objective functions according to the iterations |
|
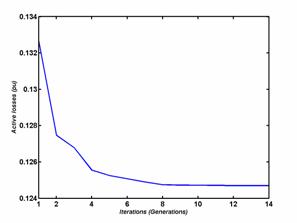
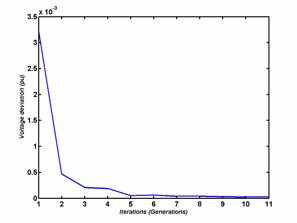
From the figures (2), we notice that the two functions active transmission losses and voltage deviation are decreasing according to the generations and convergent toward their minimal values. The active Losses function converge toward the value 0.1247 pu and the voltage deviation function converge toward the value 2.3946 10-5 pu.
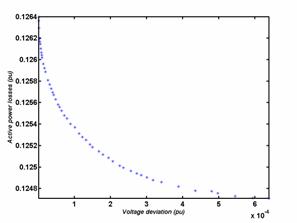
Bi Objectives optimization
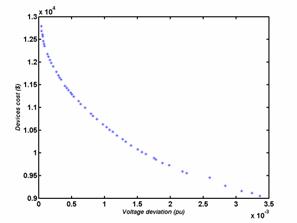
The optimal Pareto set for a bi objectives optimization of the functions of the compensation devices cost / deviation, losses / deviation and losses / compensation devices cost, are shown in figures 3, 4 and 5, respectively.
|
|
|
Figure 5. Pareto set losses /cost |
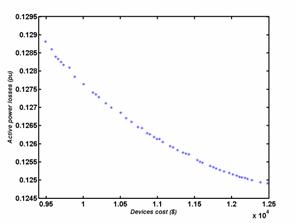
From the figures 3, 4 and 5, we can pull the limit values of every case. These values are summarized to the tables 4, 5 and 6.
Table 4. Values limits of the Pareto set Cost/Deviation
|
Minimal devices cost Corresponding deviation |
9.0523∙103 ($) 0.0034 (pu) |
Qg1(pu) |
Qg2(pu) |
Qg3(pu) |
Qg4(pu) |
Qg5(pu) |
|
0.0071 |
0.0038 |
0.0110 |
0.0144 |
0.0002 |
||
|
Minimal deviation Corresponding cost |
3.7728∙10-5 (pu) 1.2788∙104 ($) |
Qg1(pu) |
Qg2(pu) |
Qg3(pu) |
Qg4(pu) |
Qg5(pu) |
|
0.0061 |
0.3427 |
0.1344 |
0.2560 |
0.0003 |
The table 4 shows that the reactive production of the compensation devices to the bus 5 is weak in relation to the productions of the other buses. It is due to the voltage value of this bus that is very close to the one desired. Therefore, the problem can be reduced while eliminating the variable Qg5.
Table 5. Values limits of the Pareto set losses/Cost
|
Minimal losses Corresponding cost |
0.1249 (pu) 1.2541∙104 ($) |
Qg1(pu) |
Qg2(pu) |
Qg3(pu) |
Qg4(pu) |
Qg5(pu) |
|
0.0530 |
0.1523 |
0.0701 |
0.2128 |
0.2048 |
||
|
Minimal devices cost Corresponding losses |
9.4927∙103 ($) 0.1288 (pu) |
Qg1(pu) |
Qg2(pu) |
Qg3(pu) |
Qg4(pu) |
Qg5(pu) |
|
0.0072 |
-0.0039 |
0.0350 |
0.0642 |
0.0091 |
The table 5 shows that, for minimal losses, the total reactive production is important. For a minimal cost the total reactive production is weak.
Table 6. Values limits of the Pareto set losses/Deviation
|
Minimal losses Corresponding deviation |
0.1247 (pu) 6.3865∙10-4 (pu) |
Qg1(pu) |
Qg2(pu) |
Qg3(pu) |
Qg4(pu) |
Qg5(pu) |
|
0.1336 |
0.1605 |
0.1097 |
0.2517 |
0.2272 |
||
|
Minimal deviation Corresponding losses |
1.0309∙10-6 (pu) 0.1264 (pu) |
Qg1(pu) |
Qg2(pu) |
Qg3(pu) |
Qg4(pu) |
Qg5(pu) |
|
0.1512 |
0.2334 |
0.1480 |
0.2558 |
0.0047 |
The table 6 shows that the production of the bus 5 is weak for a minimal deviation, it is important when the active power losses are minimal.
Tri objectives optimization
The figures 6 illustrate the Pareto surface of Voltage deviation / Compensation devices cost / active Losses in the lines of transportation and transmission according to four different views.
|
|
|
|
|
|
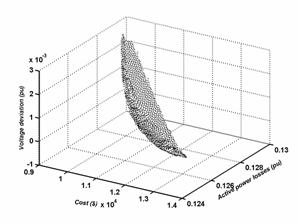
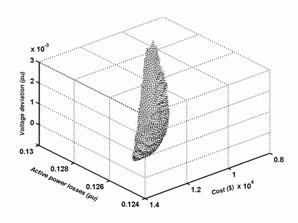
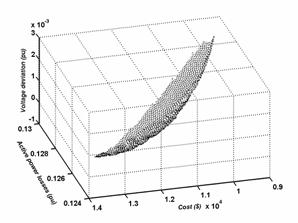
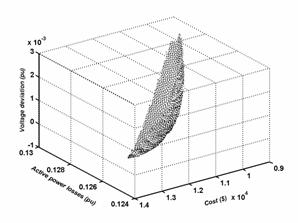
Figure 6. Pareto surface Deviation/Cost/losses
The table 7 gives the values limits of the Pareto surface of the figure 6.
Table 7. Values limits of the Pareto surface Deviation/Cost/losses
|
|
For the minimal cost |
For the minimal losses |
For the minimal deviation |
|||
|
Cost ($) |
9.0939 103 |
1.3435 104 |
1.3013 104 |
|||
|
losses (pu) |
0.1296 |
0.1247 |
0.1259 |
|||
|
Deviation (pu) |
32 10-4 |
5.7883 10-4 |
0.3265 10-4 |
|||
|
|
Qgi |
Vi |
Qgi |
Qgi |
Vi |
Qgi |
|
bus 1 |
0.0098 |
0.9763 |
0.1072 |
0.0098 |
0.9763 |
0.1072 |
|
bus 2 |
0.0099 |
0.9686 |
0.1786 |
0.0099 |
0.9686 |
0.1786 |
|
bus 3 |
0.0183 |
0.9680 |
0.1231 |
0.0183 |
0.9680 |
0.1231 |
|
bus 4 |
0.0000 |
0.9739 |
0.2326 |
0.0000 |
0.9739 |
0.2326 |
|
bus 5 |
0.0064 |
1.0000 |
0.2198 |
0.0064 |
1.0000 |
0.2198 |
From the table 7 one notice that the total production of the compensation devices is weak and voltages can have some values a little faraway of the values wanted for the minimal cost. Whereas this production becomes important and the values of voltages are very near of the values wanted for minimal losses and the minimal deviation. The staff responsible for the dispatch must choose a solution that is a compromise between the various objectives.
Conclusion
In this paper, an approach based on the SPEA2 method has been presented and applied to the multi objectives reactive dispatch problem of an electric network including a wind power station.
The problem has been formulated as a multi objectives problem, while taking into account the active losses, compensation devices cost and the voltage deviation functions.
The results show that the proposed approach is efficient for solving the multi objective reactive dispatch problem. The non dominated solutions obtained are well distributed and have satisfactory diversity characteristics.
Since this approach doesn't impose a limitation on the number of objectives, one can spread our problem while adding other objective functions as well as other constraints.
Annex
The per unit system (pu) is widely used in the power system industry to express values of voltages, currents, powers, and impedances of various power equipment. For a given quantity (voltage, current, power, impedance, torque, etc.) the per unit value is the value related to a base quantity.
For instance Ogi in (pu) = [Qgi in (MVAR)]/[Sb in (MVA)] with Sb: Apparent power = 100MVA
References
[1] Bouktir T., Slimani L., Belkacemi M., A Genetic Algorithm for Solving the Optimal Power Flow Problem, Leonardo Journal of Sciences, 2004, 4, p. 44-58.
[2] Bouktir T., Slimani L., Optimal Power Flow of the Algerian Electrical Network using an Ant Colony Optimization Method, Leonardo Journal of Sciences, 2005, 6, p. 43-57.
[3] Wei Yan, Shuai Lu, David C. Yu, A Novel Optimal Reactive Power Dispatch Method Based on an Improved Hybrid Evolutionary Programming Technique, IEEE Trans. Power Systems, 19(2), May 2004.
[4] Kenji Iba, Reactive Power Optimization by Genetic Algorithm, IEEE Trans. Power Systems, 9(2), p. 685-692, May 1994.
[5] Horn J., Nafpliotis N., Goldberg D. E., A niched Pareto genetic algorithm for multi objectives optimisation, Proceedings of the First IEEE Conference on Evolutionary Computation, IEEE World Congress on Computational Intelligence, Vol. 1, p. 82-87, 1994.
[6] Abido M. A., A niched Pareto genetic algorithm for multi objectives environmental / economic dispatch, Electrical power and energy systems, 2003, p. 97-105.
[7] Alexandre H., Dias F., Jõao A. de Vasconcelos, Multiobjective Genetic Algorithms Applied to Solve Optimization Problems, IEEE Trans. Magnetics, 38(2), p. 1133-1136, March 2002.
[8] Zitzler E., Thiele L., An Evolutionary Algorithm for Multi objectives Optimization: The Strength Pareto Approach, TIK-Report no. 43, 1998.
[9] Zitzler E., Laumanns M., Thiele L., SPEA2: Improving the Strength Pareto Evolutionary Algorithm, TIK-Report no. 103, May 2001.
[10] Mansour M. O., Abdel-Rahman T. M., Non-linear VAR Optimization using Decomposition and Coordination, IEEE Trans. Power Apparat. Systems, PAS-103, no. 2, p. 246-255, 1984.
[11] Abril I. P., González J. A., VAR Compensation by Sequential Quadratic Programming, IEEE Trans. Power Systems, 18(1), p. 36-41, February 2003.
[12] Hsiao Y. T., Chiang H. D., Liu C. C., Chen Y. L., A Computer Package for Optimal Multi-objective VAR Planning in Large Scale Power Systems, IEEE Trans. Power Systems, 9(2), p. 668-676, May 1994.
[13] Miu K., Chiang H., Darling G., Capacitor Placement, Replacement and Control in Large-Scale Distribution Systems by a GA-Based Two-Stage Algorithm, IEEE Trans. Power Systems, 12(3), p. 1160-1166, August 1997.
[14] Delfanti M., Granelli G., Marannino P., Montagna M., Optimal Capacitor Placement Using Deterministic and Genetic Algorithms, IEEE Trans. Power Systems, 15(3), p. 1041-1046, August 2000.
[15] Varilone P., Carpinelli G., Abur A., Capacitor Placement in Unbalanced Power Systems, 14th PSCC, Sevilla, Session 03, paper 2, p. 1-6, 24-28 June 2002.
[16] MA J. T., Lai L. L., Evolutionary Programming Approach to Reactive Power Planning, IEE Proc. - Gener. Transm. Distrib., 143(4), p. 365-370, July 1996.
[17] Das D., Reactive Power Compensation for Radial Distribution Networks using Genetic Algorithm, Electrical Power and Energy Systems 24, p. 573-581, 2002.
[18] Abido M. A., Bakhashwain J. M., Optimal VAR Dispatch using a Multiobjective Evolutionary Algorithm, Electrical Power and Energy Systems 27, p. 13-20, 2005.
[19] Begovic M., Radibratovic B., Lambert F., On Multiobjective Volt-VAR Optimization in Power Systems, Proceedings of the 37th Hawaii International Conference on System Sciences, p. 1-6, 2004.
[20] Bhattacharya K., Zhong J., Reactive Power as an Ancillary Service, IEEE Trans. Power Systems, 16(2), p. 294-300, May 2001.
[21] Li F., Pilgrim J. D., Dabeedin C., Chebbo A., Aggarwal R. K., Genetic Algorithms for Optimal Reactive Power Compensation on the National Grid System, IEEE Trans. Power Systems, 20(1), p. 493-500, February 2005.
[22] Barán B., Vallejos J., Ramos R., Fernández U., Multi-Objective Reactive Power Compensation, Proc. IEEE Transmission and Distribution Conference and Exposition, p. 97-101, Atlanta, USA. 2001.
[23] Farag A., Al-Baiyat S., Cheng T. C., Economic load dispatch multi objectives optimization procedures using linear programming techniques, IEEE Trans. Power Systems., 10(2), p. 731-738, 1995.