Optimization of the Fermentation Process in a Brewery with a Fuzzy Logic Controller
Philip Babatunde OSOFISAN
Department of Electrical and Electronics Engineering, University of Lagos, Akoka, Lagos
Abstract
In this research work, the fermentation process in a Brewery will be optimized, with the application of Fuzzy Logic Controller (FLC). Fermentation is controlled by regulating the temperature, the oxygen content and the pitch rate; but the temperature plays a dominant role in the optimization of the fermentation process. For our case study (Guinness Nigeria Plc) the optimal fermentation temperature is 16ºC, so the FLC has been designed to maintain this temperature. The designed FLC can also be applied to maintain any other optimal fermentation temperature e.g. 20ºC. These two cases have been investigated. The FLC has been stimulated on a digital computer using MATLAB 5.0 Fuzzy Logic Tool Box.
Keywords
Fermentation process; Optimization; Fuzzy Logic Controller; Simulation
Introduction
Beer is judged by its physical and sensory characteristics. Traditionally the master brewer who controlled the process based on prior art, knowledge and experience managed these properties. In modern breweries, the position of master brewer has largely been devolved into component functions, some of which capture the old art of the master brewer but most of which are associated with the control of process sequence. Physical parameters can be measured with accuracy. Most chemical and biochemical characteristics are not readily measurable on-line and are usually analyzed in the laboratory. On-line assessment of biological parameters should provide a coherent database for decision-making and process management using artificial intelligence based systems. The challenge is to develop a suite of sensors that can measure compounds that define the critical steps in the process as well as those compounds that predict beer stability and sensory quality.
The application of intelligent systems for palletisation optimization, fermentation, predicting mash stand-time and optimization of filtration has been investigated. These projects have shown that intelligent systems can significantly improve efficiency throughout the brewery.
Automation of manufacturing processes has become a necessity for the brewery industry to increase productivity, reduce wastage and provide consistent quality product to keep ahead of competitions.
Some of the various automated processes include: Filtration, Mashing, Fermentation and the Finishing. Therefore, in this study, we are considering especially the fermentation process and the application of a Fuzzy Logic Controller for its optimization.
The Fermentation Process [4]
Fermentation is a very important process step in beer production. It is subject to alterations stemming from the variation in the yeast living organism and due to the complex raw materials of biological origin. The variability may manifest in the fermentation speed or cause off-flavors in beer. Thus, there is a need for tools both analytical and computational, to help in monitoring the process and keeping it in a desired course.
The main fermentation process starts with aerating the cooled wort and adding yeast to it. The yeast starts to consume the nutrients contained in wort, in order to stay alive and grow. At the same time the yeast produces alcohol and esters. The sugar content of the wort is the primary measurement by which the course of the fermentation is followed; the main fermentation is deemed to be ended when the sugar content falls below a predefined concentration level so that only a small amount of fermentable sugars remain. The sugar content of the wort is expressed by the specific gravity of the wort; the wort gets lighter as sugar is converted to alcohol and other compounds.
Fermentation is controlled by regulating the temperature, oxygen content, and the pitch rate i.e. the amount of yeast put into the fermentation tank. Temperature has a great effect on both the speed of fermentation and the flavor of beer. The growth of yeast can be controlled by the oxygen content. The pitch rate affects the fermentation speed but not as much as the temperature. In addition, the course of fermentation is affected by other factors such as the wort composition and the yeast condition. Ideally these factors should be constant, so that the predictability of fermentation is maintained. However, in practice neither the wort composition or yeast condition is static. The natural variation of malt induces some variation to the wort composition although such variations can be diminished by re-planning the mashing recipes.
Fermentation Process Temperature Control
As mentioned above the reaction that takes place in the fermenter between the yeast and the wort is an exothermic reaction i.e. heat is generated. Since fermentation is desired at a specific temperature i.e. 16°C for lager temperature, control equipment is employed to constantly keep the temperature at the desired value [5].
The block diagram for a typical fuzzy temperature controller is shown below in Figure 1 below.
Figure 1. Block diagram of fuzzy logic control feedback loop system
Design of a Fuzzy Logic Temperature Controller [10, 12]
With the help of fuzzy logic controller we want to control the coolant valve in brewery fermentation temperature control system. The opening and the closing of the valve is directly controlled by a servomotor coupled to it i.e. servo-controlled valve.
For our case study (Guinness Nigeria Plc), the optimum temperature in the fermenter (To) is designed to be 16ºC and that is the value we want to maintain all the time if possible. It is known that in some periods of the day the temperature (TX) can oscillate around the optimum value because of different reasons (chemical reaction etc).
The aim of this design is to vary the voltage at the output of the controller to the servomotor so that the motor can control the valve thus regulating the flow of the coolant to the fermenter.
Figure 2. Schematic diagram of temperature control in fermentation process
Fuzzification
STEP 1
We define (3) linguistic values for the fuzzy system as:
· Temperature error, e (ºC) as the difference between temperature measured by the thermocouple (Tx) and the optimal temperature (set value, To) i.e.
· Temperature error, e = Tx To, where To = 16ºC
· Temperature error. dot, er (ºC /S) as the rate of change of the temperature. It shows the trend of temperature change.
· Voltage (V) as the output from the controller in the range 0-10V; 0 V means that the motor is not operated and the valve is fully closed while 10V implies that the servomotor is fully operated and the valve is fully opened.
STEP 2
We now add membership functions to each linguistic value i.e.
· Temperature error, e (ºC) has three (3) membership functions namely:
a) Negative Þ Tx < To
b) Zero Þ Tx = To
c) Positive Þ Tx > To
· Temperature error. dot, er (0c/S) also has three membership functions
a) Negative Þ Temperature is decreasing
b) Zero Þ Temperature is not changing
c) Positive Þ Temperature is increasing
· Finally, output voltage (V) has four membership functions,
a) Zero
b) Small
c) Middle
d) Large
STEP 3 - FUZZY MAPPING
The membership functions for each value are defined as thus: Membership Functions of the Fuzzy Sets (see figures 3-5)
Figure 3. Temp. error
Figure 4. Temp.-error.dot
Figure 5. Output Voltage
STEP 4
Now based on the behavior and knowledge of the fermentation system i.e. exothermic reaction, we define the following rules (see figure 6).
Rules Structure and Rule Matrix
|
Output = output voltage |
Temperature error (ºC) |
|||
|
N |
Z |
P |
||
|
Temperature error. dot (ºC/S) |
N |
Zero |
Zero |
Zero |
|
Z |
Zero |
Zero |
Small |
|
|
P |
Small |
Middle |
Large |
|
|
N = Negative; Z = Zero ; P = Positive |
||||
Figure 6. The Rule Matrix
System Modeling Using Fuzzy Logic Tool Box
Fuzzy logic toolbox is employed in this project to model the design. Graphical users interface (GUI) tools are provided by fuzzy logic box. It is much easier to build up a system graphically. [9]
There are four (4) primary GUI tools for building, editing, and observing fuzzy inference systems in the fuzzy logic box.
¸ Fuzzy Inference System (FIS) editor (FIS editor handles issues such as the numbers of input and output variables; their names etc.)
¸ Membership function editor (Membership function editor defines the shapes of all the membership functions associated with each variable)
¸ Rule editor (Rule editor is used for editing the list of rules that define the behavior of the system)
¸ Rule viewer (Rule viewer is used for looking at the fuzzy inference system (FIS))
Shown below are the diagrams of all the three (3) GUI tools when used to model the fuzzy system. [see figures 7-9].
Figure 7. Temperature error membership function editor GUI

Figure 8. Temperature error.dot membership editor GUI
Figure 9. Output voltage (V) membership function editor (GUI)

Figure 10. Temperature error modified membership function

Figure 11. Temperature error. dot modified membership
Figure 12. Output voltage modified membership function
System Simulation Using SimuLink
Once the fuzzy system has been created using the GUI tools, the system can be embedded directly into simulation.
Fuzzy logic toolbox is designed to work with SimuLink software that can be used to simulate designs or systems.
One of the great advantages of the fuzzy logic toolbox is the ability to take fuzzy systems directly into SIMULINK and test them out in a simulation environment.
Figure 13. Fuzzy temperature controller simulation block diagram
Tuning and System Enhancement
Tuning and debugging of the fuzzy temperature controller design can be done by changing the rules, changing the centers of the input and/or output membership functions or adding additional degrees to the input and/or output functions.
Tuning the system amounts to manipulating the rules and membership function definition parameters to achieve acceptable system response.
Figures 10, 11 & 12 show the input and the output membership functions after modification. The centers of the triangles representing the negative and positive membership functions for the two inputs have been changed so as to achieve the desires result i.e. little or no overshoot is rendered. Fig.13 shows the block diagram of the fuzzy temperature controller
The diagrams (Figure 14 to Figure 21) show 2 cases when:
· To is kept at 16ºC (Figures 14-17)
· To is kept at 20ºC (Figures 18-21)
Results
Several responses can be observed during the simulation of the system. The system is tuned by modifying the rules and membership functions until the desired system response is achieved. Then the system can be interfaced to the real world via some C+ programs.
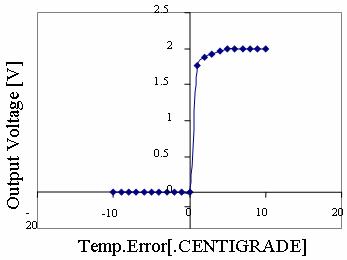
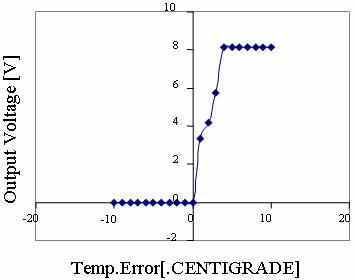
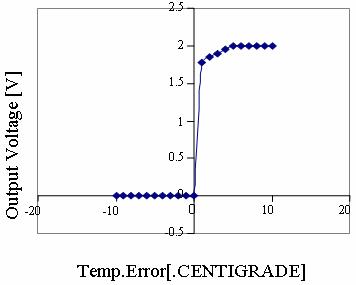
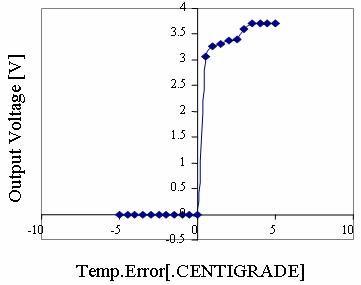
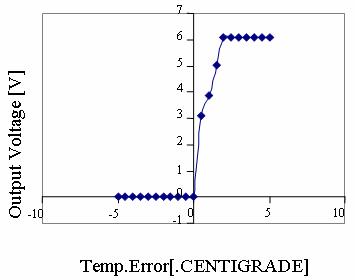
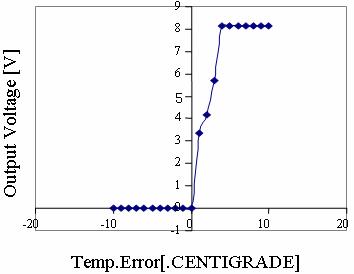
The curves (Figure 14 to Figure 21) describe the response curves as error decreases towards zero and then changes to a positive value. The rate-of-change of the error has been assumed to be constant. The values of the errors and error.dot indicated as in the diagram are inserted into the rule base under the view rule editor and the outputs computed for all the cases are recorded.
|
|
|
|
|
Figure 14. CASE 1A: System Response Curve Temperature error.dot = -1.0 (ºC/S) To = 16 ºC |
|
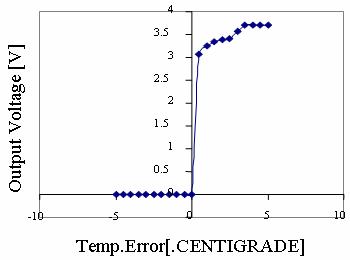
Figure 15. CASE 1B: System Response Curve Temperature error.dot = -0.5 (ºC/S) To = 16ºC |
|
|
|
|
|
Figure 16. CASE 1C: System Response Curve Temperature error.dot = +0.5 (ºC/S) To = 16 ºC |
|
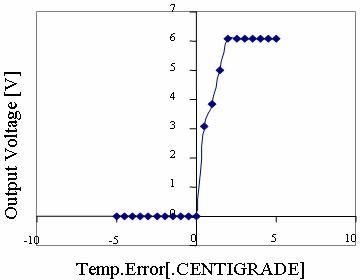
Figure 17. CASE 1D: System Response Curve Temperature error.dot = +1.0 (ºC/S) To = 16ºC |
Also shown are the corresponding system response curves for all the cases observed. (Figure 14 to Figure 21)
It is observed from the responses how the non-linear system is brought under control.
The output response remains constant at the desired optimal temperature. Very slight overshoot is observed in cases 1c & 1d. These, however, can be eliminated by further tuning the system by modifying the membership functions or manipulating the rules until the most desired response is obtained.
It is further observed from the response graphs that the output voltage remains at zero for negative error values. This explains the initial stage when the temperature is allowed to rise by the exothermic reaction while the valves remain shut.
|
|
|
|
|
Figure 18. CASE 2A: System Response Curve Temperature error.dot = -1.0 (ºC/S) To = 20 ºC |
|
Figure 19. CASE 2B: System Response Curve Temperature error.dot = -0.5 (ºC/S) To = 20ºC |
|
|
|
|
|
Figure 20. CASE 2C: System Response Curve Temperature error.dot = +0.5 (ºC/S) To = 20 ºC |
|
Figure 21. CASE 2D: System Response Curve Temperature error.dot = +1.0 (ºC/S) To = 20ºC |
Conclusions
This project has demonstrated fuzzy logic control as a better control method than the conventional PID method, for control systems. It shows the ease with which the control system can be designed and implemented.
The responses also show that fuzzy logic control method gives a better overall performance with minimal or no overshoots and undershoots.
Automated systems and experts systems as applied to breweries have traditionally interacted with physical or chemical control points and parameters of the process (i.e. pressure, temperature, flow rate, pH). A plant process control regime based on these types of parameters is inherently sub-optimal as these parameters are related to the process itself and are only indirectly linked to the wort, beer, or the original malt. The integration of on-line biosensors into intelligent real-time assessment and control systems will provide a much greater level of control both for the process (i.e. optimization of resource usage etc) as well as the beer itself (i.e. sensory characteristics).
References
1. Pecar M., Lees M., Campbell B., An alternative control strategy for D. E. dosing rates of primary beer filteration, http://www.regional.org.au, 1999.
2. Tun Tavern Inc. U.S.A., Abstract on TUN TAVERN BREWERY, http://www.tuntavery.com (Our brewing process).
3. Diadom Knot Brewing Company, Publication on brewing process, http:///www.diamondknot.com (Our brewing).
4. Fredrick Robinson Limited, U.K., Publication on brewing process, http://www.frederic-robinson.com (The brewing process).
5. Guiness Nigeria Plc (1998): Publication on Case Study. Guiness Nigeria Plc, Ikeja Plant. Guiness Press.
6. Pollanen J., Rousu J., A neural network tool for brewery fermentation, http://www.cs.helsinki.fi/, 2001.
7. Cummins S., Plant N., OConnor J. B., Optimization of brewery operations using fuzzy logic and simulation tools, http://www/cs/Helsinki.fi/
8. Wireless Week Article, Temperature control: PID Vs. Fuzzy Logic, http://www.wirelessweek.com
9. Fuzzy Logic Control Tool Box, Users Guide Version 2. Oct. 1998, the Maths Works Inc.
10. Apronix Inc., Fuzzy Logic From Concept to Implementation, http://www.aptronix.com , 1993.
11. Basehore P. B., Fuzzy Logic Outperforms PID Controller, PCIM, 1993, p. 40-46.
12. Sugeno M., Industrial Application of Fuzzy Control, North Holland, New York, 1985.
13. Cox E., Fuzzy Fundamentals, IEEE Spectrum, 1992, p. 58-61.
14. Lee C. C., Fuzzy Logic in Control Systems, IEEE Trans. on Systems Man and Cybernetics, SMC, 1990, 20, p. 404-435.
15. Crueger W., Crueger A., Biotechnology, Sinamer Associates, 2nd Edition, Sunderland MA, 1990, p. 143-147.
16. Ghose T. K., Bhadra A., Comprehensive Biotechnology, Moo Young M., Pergamon, New York, 1985, 3, p. 701-729.