Fuzzy Logic Control of the Syrup Mixing Process in Beverage Production
Philip Babatunde OSOFISAN
Department of Electrical and Electronics Engineering, University of Lagos, Akoka, Lagos
Abstract
The mixing process plays a pivotal role in the beverage production because it determines the rate of production output. Therefore, it is necessary that a proper control of the inputs be put in place. The rate of mixture of the concentration has been stochastic in nature and unstable in its waveform, therefore a fuzzy logic control of the mixing process has been developed and implemented in a bottling company production plant (the Nigerian Bottling Company Plc as a case study), so that a stable and optimal mixing process is guaranteed. Simulation of the various production processes has been carried out using the MATLAB/SIMULINK software package.
Keywords
Mixing Process; Beverage Production; Concentration; Fuzzy Mapping; Fuzzy Logic Control; Simulation
Introduction
Many applications show that fuzzy logic controller (FLC) is superior to conventional control algorithms in terms of design simplicity and control performance. In particular, the FLC methodology appears very appealing when the processes are too complex for analysis by conventional quantitative techniques or when the available sources of information are interpreted qualitatively, inexactly or uncertainly. Thus, FLC may be viewed as an approach combining conventional precise mathematical control and humanlike decision-making. The greatest drawback of fuzzy logic is in the theoretical ground, the lack of rigorous stability and robustness analysis techniques. Although, both stability tests and robustness analysis have been investigated for lower-order systems, most stability analysis methods for FL are based on approximations, and there is no rigorous way to obtain a measure of robustness [12].
The major goal of this research work is to design and realize a fuzzy logic controller for the mixing operation of water, sugar and concentrates in the final product - the beverage link.
Fuzzy Logic Model
A fuzzy logic model with its fundamental input-output relationship consists of four components namely, the fuzzifier, the inference engine, the defuzzifier, and a fuzzy rule base (Figure 1).
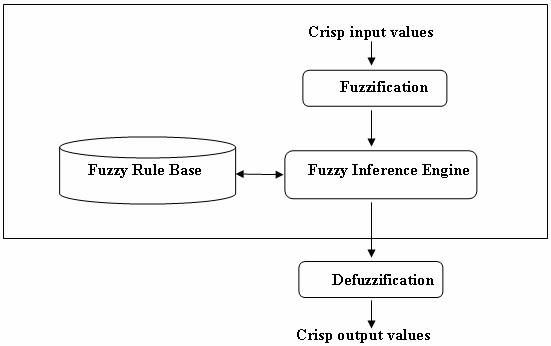
Figure 1. Structure of a Fuzzy Logic Model
In the fuzzifier, crisp inputs are fuzzified into linguistic values to be associated to the input linguistic variables. After fuzzification, the inference engine refers to the fuzzy rule base containing fuzzy IF-THEN rules to derive the linguistic values for the intermediate and output linguistic variables [11]. Once the output linguistic values are available, the defuzzifier produces the final crisp values from the output linguistic values.
A basic FLC system is shown in Figure 2, which comprises four principal components [3, 4]:
· A fuzzy interface (FI), which is somewhat like an A/D converter in digital control.
· A decision-making logic (DML), which is like a digital controller.
· A defuzzification interface (DFI), which functions like digital theorems.
· A knowledge base (KB), which comprises a knowledge of application domain and control goals to be met.
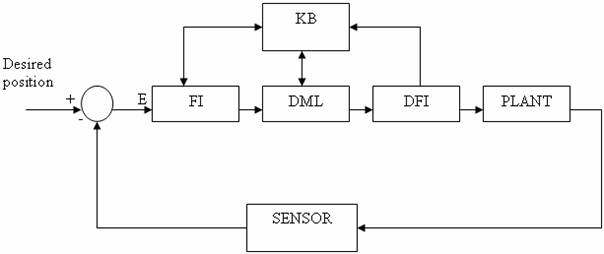
Figure 2. Basic Configuration of Fuzzy Logic Control System
In the design of a conventional controller such as a PID controller, what is modeled is the system or process to be controlled, whereas in the design of a fuzzy logic controller, the focus is the human operators behavior.
The Production of Beverages (see Figure 3)
The production of the beverages starts from the preparation of simple syrup (solution of sugar and water). In other words, the simple syrup is prepared by making a solution of sugar and water; the combined product is well stirred in the mixing machine with the aid of agitator. The simple syrup is then taken via pipes into another mixing machine in the compartment called the syrup room where the simple syrup is added to concentrates in order to prepare the finished syrup. The addition of simple syrup and the concentrates gives the soft drink otherwise known as the beverage. The type of the concentrate (such as coca-cola, fanta orange, sprite and so on) added to the simple syrup gives the corresponding beverage. The final beverage is prepared by diluting with carbonated water and then bottled.
Prior to the bottling of the carbonated beverage, the bottles are subjected to thorough sanitation processes and these include; soaking, heating, washing, rinsing and drying. After these processes, the carbonated beverage is filled accordingly into the bottles of various volumes. Subsequently, the bottles are corked, labeled and sorted into crates.
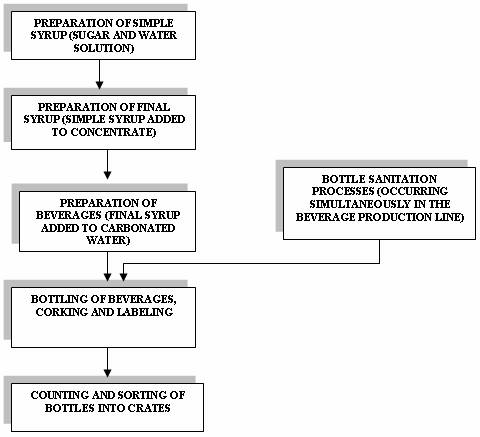
Figure 3 Basic Operations in the Nigerian Bottling Company PLC Beverages Production
Modeling the Sugar-Water Input-Output Relationship
One of the first things to consider when designing a model is the range for the input variables [5].
Table 1. Input-output values for coca-cola beverage brand
|
|
Contents |
Range of contents |
Table |
|
1 |
Unit H20 |
0 < x ≤ 185 liters |
Figure 8 |
|
2 |
Unit sugar |
0 < x ≤ 350 kg |
Figure 9 |
|
3 |
STD Syrup Brix |
0 < x ≤ 290 liters |
Figure 10 |
|
4 |
Carbonation |
0 < x ≤ 50 liters |
Figure 11 |
|
5 |
Final volume |
0 < x ≤ 450 liters |
Figure 12 |
From the range of values of the initial input variables/components (sugar and water) given above, taking coca-cola brand as an example, we use these range of values (for initial unit of water, initial unit of sugar, final volume, standard syrup brix and carbonation value) as the universal space for our input variable. This forms the basis of our fuzzy expert system.
The critical input variables in the production of coca-cola is given as water and sugar which gives the simple syrup while the output variables are given as the final syrup which contains the simple syrup with additional coca-cola concentrates and carbonated water. The input-output variables are represented in the diagram below (Figures 4 and 5).
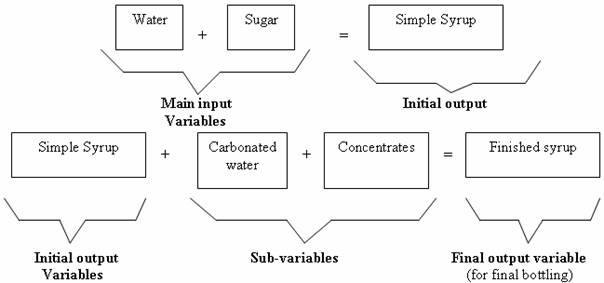
Figure 4. FLC system for the case study
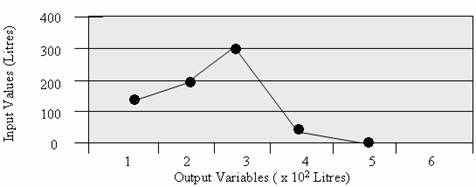
Figure 5. Representing Coca-cola input-output variables
Fuzzification
The production processes of the bottling plant being represented with ASM (Algorithm State Machine) is used here for modeling with a specific attention drawn to the addition of water or sugar to the finished syrup in order to obtain the final beverage (Figure 6).
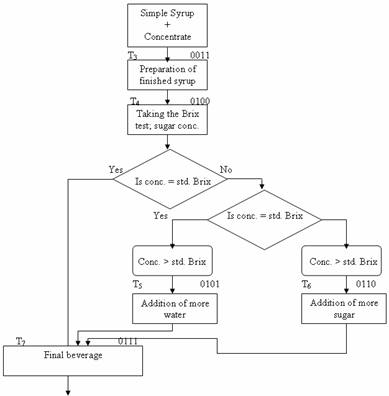
Figure 6. ASM Chart for water - sugar relationship for the production of final beverage
Fuzzy Mapping
Through the use of membership functions defined for each fuzzy set for each linguistic variable, the degree of membership of a crisp value in each fuzzy set is determined. The numerical variable, unit of water and sugar which have given values as shown in the Table 2 were fuzzified using the triangular membership functions defined for each fuzzy set for linguistic variables water and sugar. As a result of fuzzification, linguistic variables water and sugar are assigned linguistic values of lower or high concentration with corresponding degree of membership (Figures 7-11).
Formation of Fuzzy Sets
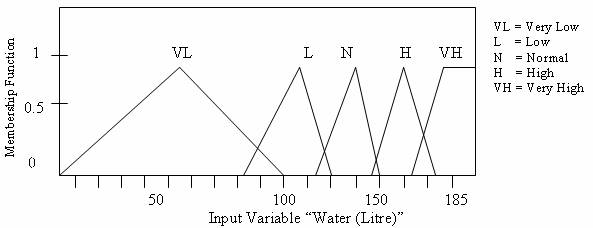
Figure 7. Membership Function Plots (water)
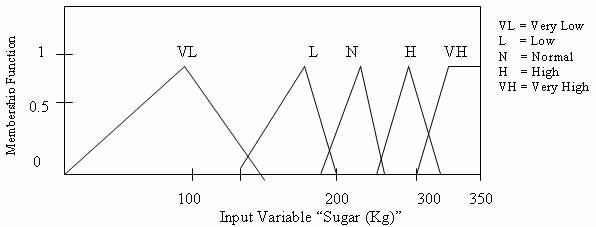
Figure 8. Membership Function Plot (sugar)
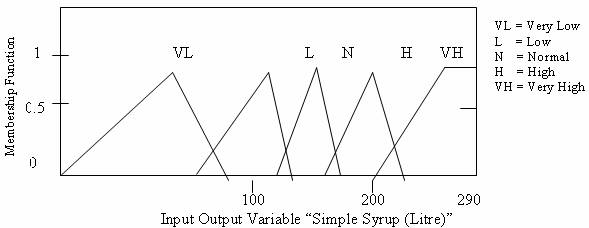
Figure 9. Membership Function Plots (Simple Syrup)
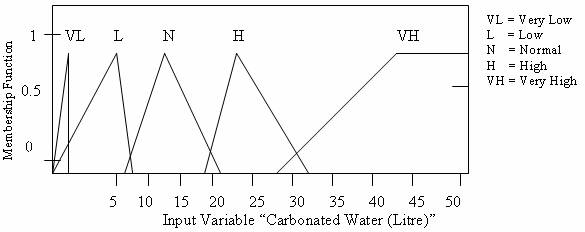
Figure 10. Membership Function Plots (Carbonated Water)
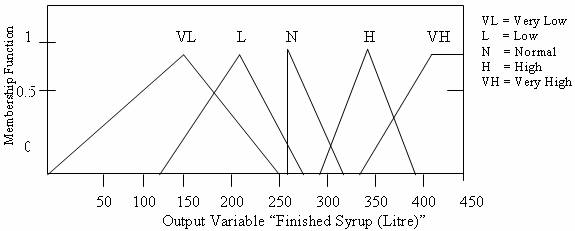
Figure 11. Membership Function Plots (Finished Syrup)
Inference Engine
Once all crisp input have been fuzzified into their respective linguistic values, the inference engine will access the fuzzy rule base of the fuzzy expert system to derive linguistic values for the intermediate as well as the output linguistic variables.
The two main steps in the inference process are aggregation and composition. Aggregation is the process of computing for the values of the IF (antecedent) part of the rules while composition is the process of computing for the values of the THEN (consequent) part of the rules.
During aggregation, each condition in the IF part of a rule is assigned a degree of truth based on the degree of membership of the corresponding linguistic term. From here, either the minimum (MIN) or product (PROD) of the degrees of truth of the conditions is usually computed to clip the degree of truth of the IF part. This is assigned as the degree of truth of the THEN part.
Rule Base
The Fuzzy Rule Base is characterized by construction of a set of linguistic rules based on experts knowledge. The expert knowledge is usually in the form of IF-THEN rules, which can be easily implemented by fuzzy conditional statements.
· Rule 1: IF (sugar conc. = low) and (water conc. = normal) THEN (add more sugar)
· Rule 2: IF (sugar conc. = high) and (water conc. = normal) THEN (add more water)
· Rule 3: IF (water conc. = low) and (sugar conc. = normal) THEN (add more water)
· Rule 4: IF (water conc. = high) and (sugar conc. = normal) THEN (add more sugar)
Concise rules to the final volume of the output are simply given below;
· Rule 5: IF (water conc. = high) THEN (add more sugar)
· Rule 6: IF (sugar conc. = high THEN (add more water)
· Rule 7: IF (sugar AND water conc. = Normal) THEN Output is Normal
Defuzzification
The last phase in the modeling fuzzy expert system is the defuzzification of the linguistic values of the output linguistic variables into crisp values. The most common techniques for defuzzification are Center-of-Maximum (CoM) and Center-of-Area (CoA).
CoM first determines the most typical value for each linguistic term for a output linguistic variable, and then computes the crisp value as the best compromise for the typical values and respective degrees of membership.
The most typical value of each linguistic term is the maximum of the respective membership function. If the membership function has a maximizing interval, the median of that interval is taken. For the output variable final water and sugar conc. Or standard brix conc. In the production of coca-cola final beverage, the most typical values for the linguistic terms water conc. low, sugar conc. low, water conc. high, sugar conc. high, add more water and add more sugar, are 1, 2, 3, 4, 5, and 6 respectively.
After identifying the typical values, the crisp value is computed as the best compromise for the given typical values and respective degrees of membership using weighted mean. The respective degrees are used as the respective weights.
The other common method, CoA, or sometimes called Center-of-Gravity (CoG), first cuts the membership functions of each linguistic term at the degrees corresponding to the linguistic values. The superimposed areas under each cut membership function is balanced to give the compromised value. A disadvantage of this technique is the high computational demands in computing for the areas under the membership functions.
There are other variants of computing for crisp values from linguistic values. These are Mean-of-Maximum (MoM), Left-of-Maximum (LoM) or Smallest-of-Maximum (SoM), Right-of-Maximum (RoM) or Largest-of-Maximum (LoM), and Bisector-of-Area (BoA).
The method used in this research work is the Center-of-Maximum (CoM) due to its simplicity and popularity.
Simulation Results
In order to achieve a simplified and users friendly Computer Aided Design package for this stage, MATLAB/SIMULINK software package is employed.
The model is the unfuzzified sugar - water (simple syrup) simulation. The corresponding waveforms for both the inputs and output are shown in Figures 12 and 13. It is observed that the waveforms for the variables (sugar and water) are not stable sporadic and stochastic in nature (Figures 12 and 13), hence the concentration rate of the two variables cannot be accurately determined. The waveform of the unfuzzified sugar - water (simple syrup) output equally shows instability and discontinuity (Figures 14).
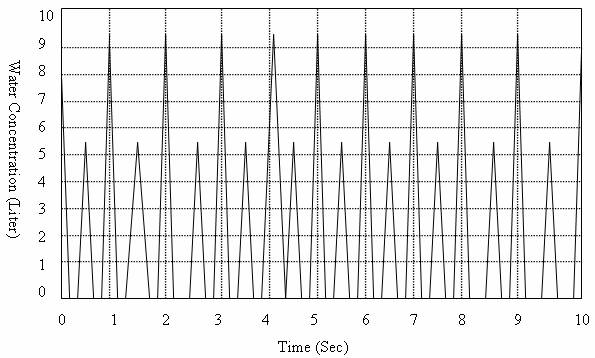
Figure 12. Unfuzzified Water Input Variable
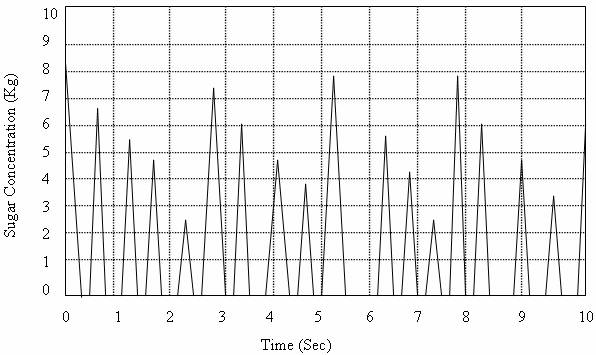
Figure 13. Unfuzzified sugar input variable
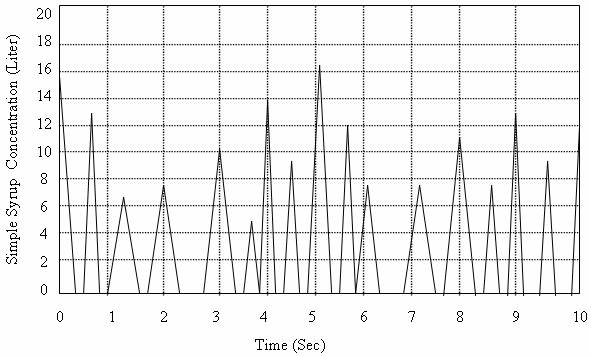
Figure 14. Unfuzzified sugar - water (simple syrup) output
Model 2 is the fuzzy logic model application to the mixing operation of the two major inputs variables; water and sugar. With the processes of fuzzification, the following graphs were obtained for the output variable (simple syrup) (Figures 15 and 16).
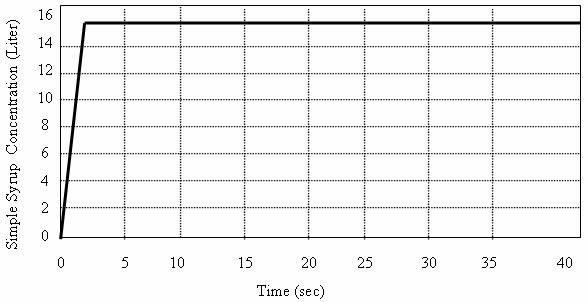
Figure 15. Fuzzified Sugar Water (Simple Syrup) Output
![]()
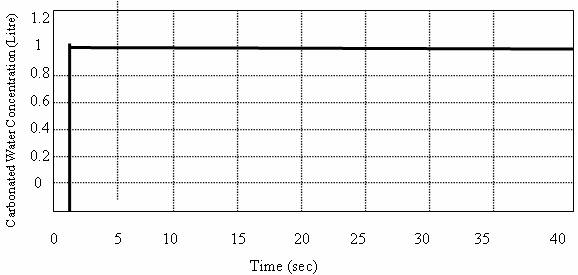
Figure 16. Fuzzified Carbonated Water Concentrate
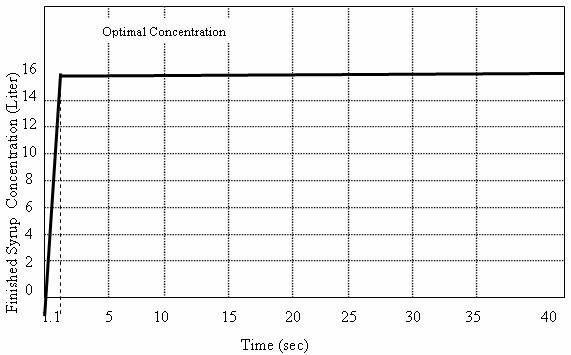
Figure 17. Finished Syrup Output
![]()
![]() In order to achieve a
stable concentration output rate of the finished syrup, the other input variables
(concentrate and carbonated water) are equally subjected to fuzzy mapping and
simulated with SIMULINK for the production process. These input variables also
contribute to the stability of the finished syrup output as can be seen in Figure
16.
In order to achieve a
stable concentration output rate of the finished syrup, the other input variables
(concentrate and carbonated water) are equally subjected to fuzzy mapping and
simulated with SIMULINK for the production process. These input variables also
contribute to the stability of the finished syrup output as can be seen in Figure
16.
It is noted that the waveforms of unfuzzified sugar and water variables are not stable, discontinuous and stochastic in nature; therefore, the simple syrup concentration within a given time cannot be determined. Hence, a continuous flow of supply of simple syrup is subjected to Fuzzy Logic control simulation processes using Simulink (model 2) over a given and monitored period. The result is that a stable waveform is achieved and therefore, the optimal concentration of the simple syrup from the waveform output could be determined.
From the graph of the fuzzified sugar - water (simple syrup) out (Figure 15), the concentration (rate of output production) becomes optimal when the rate of fuzzified input of both sugar and water is about 15lit/sec. Equally, the finished syrup output is optimal when the output rate of the entire variable is about 16lit/sec (Figure 17).
From the output graph of the fuzzified sugar water (simple syrup) concentration (Figure 16), the optimal output concentration is at 15litre at 0.9 seconds.
Hence, the rate of output production for the region 0 < t < 0.9 sec is given as:
Concentration (litre)/Time (sec) = 15/0.9 = 16.67 liters/sec
From the output graph of the fuzzified finished syrup concentration (Figure 18), the optimal output concentration is at 16 liter at approximately 1.1 seconds.
Hence, the rate of output production for the finished syrup at the region 0 < t < 1.1 seconds is given as;
Concentration (liter)/Time (sec) = 16/1.1 = 14.55 liters/sec
It is observed from Figures 15 and 17 that the concentration rate (liter/seconds) of the simple syrup (without carbonated water and concentrate) is slightly higher than that of finished syrup. From this, it can be deduced that the final beverage output largely depends on the quality of the simple syrup (sugar water ratio) rather than the values of the carbonated water and the concentrate. Hence, the output concentration of the simple syrup is optimized during the mixing stage in order to optimize the final (finished syrup) i.e. in this case coca-cola.
Conclusion
This research work had presented the application of fuzzy logic control to the mixing process of the beverage production that played a major role in optimizing the final output rate of the beverage drink. It is observed that within 1.1 sec, the rate of mixture of the concentrates has stabilized, bringing about a maximal (i.e. optimal) production output.
The mixing process of the beverage production is of a complex nature, which poses some problems when applying conventional quantitative techniques in order to actualize optimal production output. With the application of Fuzzy Logic Control, a relative short time of 1.1sec is used to bring the concentrates - mixing to a stable state. Thus, Fuzzy logic Control is well suited to design approach in software modeling.
References
1. Zadeh L. A., Fuzzy Sets, Information and Control, 1965, 8, p. 338-353.
2. Zadeh L. A., Outline of a New Approach to the Analysis of Complex Systems and Decision Processes, IEEE Transactions on Systems, Man, and Cybernetics, SMC-3, 1973, p. 28-44.
3. Klir G. J., Folger T. A., Fuzzy Sets, Uncertainty and Information, Prentice-Hall, Englewood Cliffs, N. J., 1988.
4. Baldwin J. F., Fuzzy Logic and Fuzzy Reasoning, In: Fuzzy Reasoning and Its Applications, E. H. Mamdani and B. R. Gaines (eds.), London, Academic Press, 1981.
5. Wenstop F., Deductive verbal models of organizations, Int. Jrnl. of Man-Mach. Stud., 1976, 8, p. 293-311.
6. Zadeh L. A., Making computers think like people, I.E.E.E. Spectrum, 1984, 8, p. 26-32.
7. Umbers G., King P. J., An analysis of human decision-making in cement kiln control and the implications for automation, Int. Jrnl. of Man-Mach. Stud., 1980, 12, p. 11-23.
8. Yager R. R., Zadeh L. A., An Introduction to Fuzzy Logic Applications in Intelligent Systems, Kluwer Academic Publishers, 1991.
9. Marwah M., Neural network modeling techniques for electronic manufacturing processes, Masters Thesis, University of Colorado, 1996.
10. Tan J., Xie H., Lee Y. C., Establishment of a fuzzy logic model for process and control, IEEE Trans. On Manufacturing, 1995, 8(1), p. 50-61.
11. Stachowicz M. S., Kochanska M. E., Analysis of the application of fuzzy relations in modeling, Proc. North American Fuzzy Information Society 86, New Orleans, 1986.
12. Stachowicz M. S., Kochanska M. E., Fuzzy modeling of the process, Proc. of Second International Fuzzy Systems Association Congress, Tokyo, 1987.