Computation of Natural Gas Flow Rate using a Spreadsheet
Ayoade KUYE and Uzoma EZUMA
Department of Chemical Engineering, University of Port Harcourt, PMB 5323, Port Harcourt, NIGERIA
E-mail: ao.kuye@uniport.edu.ng
Abstract
Natural gas is fast becoming a major primary source of fuel in Nigeria and is normally piped to the end users. The flow rate is measured with the orifice meter. The current practice is to manually read the sales line pressure and temperature, differential pressure and static pressure. These data are then used to compute manually the flow rates using necessary conversion factors. The primary objective of this work is to develop a Microsoft Excel 2000 template for computing the flow rates of natural gas in pipelines.
The data collected from one of the gas stations in the Niger Delta Area for a period of six months in 1999 were used to validate the template. The computed flow rates are then compared with the manually calculated flow rates. It is found that the ratio of the computed to calculated flow rates is 1.00 ± 0.02 for most of the days; the range was 0.80 - 1.10. The lowest values occurred after the gas supply was disrupted for two days.
Keywords
Natural Gas; Spreadsheet; Flow Rate.
Introduction
Natural gas is a mixture of hydrocarbons that occurs in gaseous state at room temperature and pressure. Methane is the main constituent but it may also contain ethane, propane, butane, pentane, hexane, heptane and octane as well as traces of gaseous “impurities” and non combustibles. Typical analysis of natural gas is given by Perry and Green [1]. Natural gas accumulations are usually discovered in the course of petroleum exploration and production, either associated or non-associated with oil [2].
Natural gas was discovered in Nigeria around 1964 and its estimated reserve was about 124 trillion cubic feet as at 1996 [3]. It is fast becoming a major primary source of fuel in the country. Some of the natural gas based projects in Nigeria are:
· The Nigeria Liquefied Natural Gas by NNPC/Shell/Elf/Agip Joint Venture
· Mobil Oso Gas Fractionation Plant
· Chevron’s NGL Extraction Plant
· Agip Gas Re-Injection Plant
· Feedstock To Fertilizer Plant
· West African Gas Pipeline which supplies gas to Benin, Togo and Ghana.
Natural gas is normally piped to the end users who are, for now, mainly in the industrial sector of the economy. The flow rate is measured with the orifice meter. Orifice metering is one of the most commonly used metering technology in gas production and transmission. Some of the advantages of orifice meters are the low installation and maintenance cost, low uncertainty when using these meters and the ability to use these meters without having them proved or calibrated [4]. The current practice in most of the gas stations in Nigeria is to manually read the sales line pressure and temperature, differential pressure and static pressure. At the end of the day, these data are used to compute manually the flow rates after applying the necessary conversion factors.
A software that can be used to compute gas flow rate was presented by Kuye [5]. The software was written in FORTRAN language. However, as noted by Kuye and Sanni [6], FORTRAN can only give numerical outputs. The compiler for the language is also relatively expensive and not readily available on personal computers. Spreadsheets are more common and are good vehicles for preparation, plotting and analysis of data. The primary objective of this work is, therefore, to develop a Microsoft Excel 2000 template for computing natural gas flow rates. To test the template, two hourly data were collected from one of the gas stations in the Niger Delta Area of Nigeria for a period of six months in 1999.
Theoretical Background
From the general energy balance, it can be shown that the volumetric flow rate for a gas flowing through an orifice meter is given by:
|
|
(1) |
where CO is the discharge coefficient; Ab is the throat area of the orifice meter; Y is the expansion factor; b is the diameter ratio, Db/Da, Db is the orifice throat diameter; Da is the pipe diameter; r is the density of the flowing gas; DP is the differential pressure All the variables in Equation (1) must be in a set of consistent units.
Equation (1) appears to be a purely arithmetic process for the computation of flow rate. However, CO is dependent on the Reynolds number, which is itself a function of Q, Hence the final value of CO and Q are obtained by iteration [7]. Correlation for CO is given by ISO 5167-1: 1991/And. 1: 1998 (E) [8].
As a matter of convenience, most operators in the Oil and Gas industry account for the gas volume in units of 1000 cubic feet commonly referred to as Mcf. This is the unit that is used for this work. Ikoku [9] showed that, for the calculation of the quantity of natural gas, equation (1) can further be simplified to:
|
|
(2) |
where Qh is the volumetric flow rate at base conditions, (ft3/h); C is the orifice flow constant; hw is the differential pressure, (in of H2O at 600F); and Pf is the absolute static pressure, (psia). The orifice flow constant is given by:
|
C = Fb Fg Ftf Fr Y Fpv |
(3) |
where Fb is the basic orifice factor, cfh; Fg is the specific gravity factor; Ftf is the flowing temperature factor; Fr is the Reynolds number factor; and Fpv is the super compressibility factor. The factors Fg, Ftf and Fr are defined by the expressions:
|
|
(4) |
|
|
(5) |
|
|
(6) |

where SG is the specific gravity; Tf is the flowing temperature, OF; and b is a constant that is dependent on the pipe diameter, viscosity, density and velocity of gas. Values of b, Fb, Fpv and Y are given in tabular form by Ikoku [9]. Note that Equation (2) is applicable when all the variables are given in the specified units [10].
Excel 2000 Template
As can be seen from the previous section, some of the factors are in tabular forms while the others can be calculated. The tables for Fb, b, Fpv and Y are entered into the sheets named Base, ReynB, Compress and Expansion respectively. The raw data collected from the gas station are entered into the sheet named Input and the calculations are carried out in the sheet named Compute. The graphs are placed in the sheet named Graph. Each of these sheets is discussed as follows:
· Base Sheet: Part of this sheet is shown in Figure 1a. Fb is dependent on orifice diameter (inches), pipe nominal and inside diameter (inches). The data cover the range 0.25 £ Db £ 11.25 and 2 £ Da £ 16 with Db < Da. The column A contains the orifice diameter (ins), the nominal and inside pipe diameters are placed in rows 7 and 8 respectively. The data are entered in the cells ‘Base’!A8:J72
· ReynB Sheet: Part of this sheet is shown in Figure 1b. This sheet assumes an average viscosity of 6.9x10⁻⁶ 1bm/ft–sec, temperature of 600F and specific gravity of 0.65 [9]. b data are in the same range as those for Fb. The values for b are entered in the cells ‘ReynB’!A8:J72
· Compress Sheet (See Figure 1c): Fpv is a function of flowing pressure and temperature. The data are in the range 60 £ Tf £ 150OF and 0 £ P £ 1000 psig and is entered in the cells ‘Compress‘!A4:K55. The column A contains the pressure and the temperatures are placed in row 4
· Expansion Sheet (See Figure 1d): Y is dependent on b and the ratio hw /Pf. The sheet covers the range 0.1 £ b £ 0.75 and 0.£ hw /Pf £ 4.0. The values are entered in cells ‘Expansion’!A6:AA47. The column A contains hw /Pf and the b’s are placed in row 6
· Input Sheet (see Figure 2): The observed data collected from the flow station are:
o The orifice meter specification – orifice diameter, pipe nominal and inside diameter, tap location and average specific gravity of gas. These values are entered in the cells ‘Input’!BG3:BG7 as shown in Figure 2.
o Sales line pressure, sales line temperature, differential pressure and static pressure; taken every two hours for a period of six months (July – December, 1999). These values are entered into the cells ‘Input’!A13:AZ196. This is not shown here because of its size.
o The manually calculated daily volumetric flow rates for the same period of six months (see cells ‘Input’!BC13:BC196)
The observed data are used to calculate the average daily values of sales line temperature (°C), sales line pressure (psia), differential pressure (in H20), static pressure (psia) – see cells ‘Input’!BE13:BH196. The hours per stream day is also calculated by multiplying the number of samples collected by 2 and entered in cells ‘Input’!BD13:BD196.
Note that the AVERAGE function is used to compute the average values and COUNT is used to obtain the number of samples for the first row (‘Input’!BD13:BH13). The copy command is then used to fill up the remaining cells, that is, ‘Input’!BD14: BH196
· Compute Sheet: The steps involved in the computation of the volumetric flow rate can be summarized as follows:
o Convert average sales line temperature from degrees Centigrade to Fahrenheit
o Compute the various factors, that is, Equations 3 to 6 and the appropriate tables
o Compute the volumetric flow rate using Equation (2)
o Compare the computed volumetric flow rate with the one obtained from the flow station.
A part of the Compute sheet is shown in Figure 3. The formulae for the cells ‘Compute’!B8:K8 are shown in Table 1. The copy command is used to fill up the cells ‘Compute‘!B9:K191. Note that the VLOOKUP function is used to read the appropriate values from the different tables.
Table 1. Formulae used in the ‘Compute’ Sheet
|
Parameter |
Cell |
Formulas |
|
Specific Gravity Factor |
D2 |
=1/SQRT('Input’!BG7) |
|
b for Reynold No Factor |
D3 |
=IF('Input’!$BG$3<=3.434,ReynB!O8,ReynB!O9) |
|
b |
D4 |
='Input’!BG3/'Input’!BG4 |
|
Orifice Base Factor |
D5 |
=IF('Input’!$BG$3<=3.434,Base!O8,Base!O9) |
|
Temperature, OF |
B8 |
=('Input’!BE13*1.8)+32 |
|
Temperature Factor |
C8 |
=SQRT((60+460)/(B8+460)) |
|
Ö(hw Pf) |
D8 |
=SQRT('Input’!BG13*'Input’!BH13) |
|
Reynolds No.Factor |
E8 |
=1+(($D$3)/(D8)) |
|
Diff Press / Static Press |
F8 |
='Input’!BH13/'Input’!BG13 |
|
Expansion Factor |
G8 |
=VLOOKUP(F8,Expansion!$A$7:$AA$47,Expansion!$AD$11) |
|
Sup Compres Factor |
H8 |
=VLOOKUP('Input’!BF13,Compress!$A$5:$K$55,M8+2) |
|
Calculated. Volume |
I8 |
=$D$5*$D$2*C8*E8*G8*H8*D8*'Input’!BD13 |
|
Observed Volume |
J8 |
='Input’!BC13 |
|
Ratio |
K8 |
=I8/J8 |
The VLOOKUP function requires the specification of three arguments namely:
A. The row value which is the first column of the table. As can be seen from Figure 1, these values are in ascending order;
B. The range of cells containing the table
C. The column value; the IF function is used to obtain the appropriate column.
A typical example for the expansion factor is shown in Table 2. Note that Excel 2000 allows a maximum of 7 nested IF functions. Hence, as can be seen from Table 2, we have used five cells to calculate the column value since the number of columns for the expansion factor table is 26.
Table 2. Formulae for computing VLOOKUP column argument for expansion factors
|
Cell |
Formulas |
|
AD7 |
=IF(Compute!$D$4<=Expansion!B6,2,IF(Compute!$D$4<=Expansion!C6,3,IF(Compute!$D$4<=Expansion!D6,4, IF(Compute!$D$4<=Expansion!E6,5, IF(Compute!$D$4<=Expansion!F6,6,0))))) |
|
AD8 |
=IF(AD7>0, AD7, IF(Compute!$D$4<=Expansion!G6,7, IF(Compute!$D$4<=Expansion!H6,8, IF(Compute!$D$4<=Expansion!I6,9,IF(Compute!$D$4<=Expansion!J6,10, IF(Compute!$D$4<=Expansion!K6,11,0)))))) |
|
AD9 |
=IF(AD8>0, AD8, IF(Compute!$D$4<=Expansion!L6,12, IF(Compute!$D$4<=Expansion!M6,13, IF(Compute!$D$4<=Expansion!N6,14, IF(Compute!$D$4<=Expansion!O6,15, IF(Compute!$D$4<=Expansion!P6,16,0)))))) |
|
AD10 |
=IF(AD9>0, AD9, IF(Compute!$D$4<=Expansion!Q6,17, IF(Compute!$D$4<=Expansion!R6,18, IF(Compute!$D$4<=Expansion!S6,19, IF(Compute!$D$4<=Expansion!T6,20, IF(Compute!$D$4<=Expansion!U6,21,0)))))) |
|
AD11 |
=IF(AD10>0, AD10, IF(Compute!$D$4<=Expansion!V6,22, IF(Compute!$D$4<=Expansion!W6,23, IF(Compute!$D$4<=Expansion!X6,24, IF(Compute!$D$4<=Expansion!Y6,25, IF(Compute!$D$4<=Expansion!Z6,26,27)))))) |
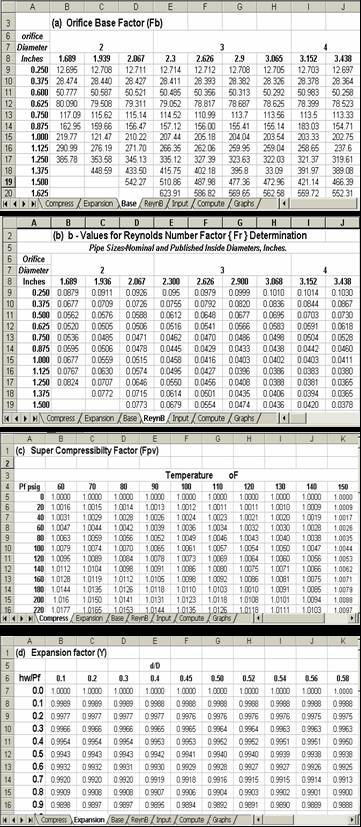
Figure 1. Tables of Factors for Flange Tap Orifice Meters
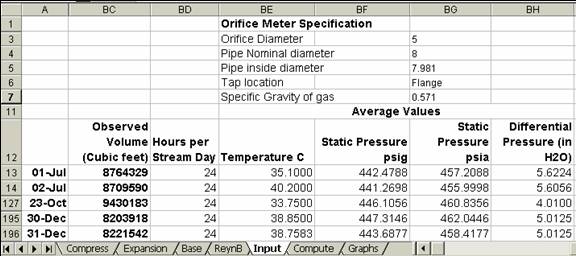
Figure 2. The Input Data Sheet
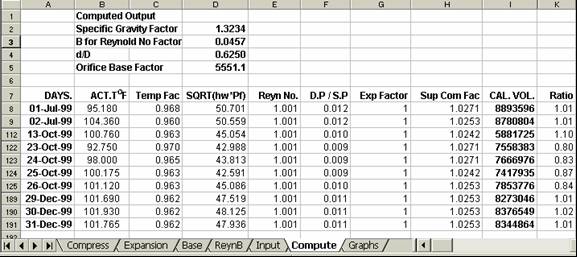
Figure 3. The ‘Compute’ Sheet
Results and Discussion
The ratio of the computed volumetric flow rate to the one obtained from the flow station, Ra, is calculated for each day. Ra is then plotted against days of the month as shown in Figure 4. The graphs indicate that Ra ranges from 0.80 to 1.10. In the manual calculation process, a single value is used for the orifice flow constant rather than making use of Equation (3). However, as can be seen from Figure 3, some of the factors (Ftf and Fpv) vary with temperature and pressure. It is apparent therefore that the manual calculations may not be very accurate. Nonetheless, except for the month of October, the computed values are within 10% of the manually calculated values. In fact, Ra values are 1.00 ± 0.02 for about 60% of the data. This shows that the template can be used to compute the natural gas flow rate. According to AGA [11], the levels of uncertainties in the coefficient of discharge obtained from tables is ±5%. Only few values (less than 8%) of Ra are outside this range as can be seen from Figure 4. A close look at Figure 4 also indicates that the manual calculations under predict the volumetric gas flow (Ra > 1.0 for most of the values). In terms of cost, this means loss of revenue to the gas company.
Figure 4. The ratio of computed flow rate to the one computed manually for July to December, 1999
During the month of October, there was an emergency shut down on October 14 and 15. The flow was restored on October 16 and it fluctuated until the end of October. This probably explains the low values of Ra for the period. During this period, the operator ignored some of the readings that were considered low while our template made use of all the data. This suggests that we need to device a means of detecting when there is an upset in the gas supply system.
Conclusion
A Microsoft Excel 2000 Template that can be used to determine the volumetric flow rate of natural gas using easily measured parameters has been developed and tested using a 6-month data from a flow station located in the Niger Delta region of Nigeria. The results indicate that the manually calculated flow rates under predict the actual flows for most of the values considered. The ratio of the computed flow rate to that obtained from the flow station is in the range 0.80 - 1.10 with majority of the values being in the range 0.98 - 1.02. This range is within the limits of the uncertainties associated with the equations used for developing the template.
References
1. Perry R. H., D. W. Green, Perry’s Chemical Engineers Handbook, Seventh Edition, McGraw Hill Company Inc., N. Y., 1997.
2. Egbuna D. O, Investment Opportunities in the Nigerian Natural Gas Industry – A Chemical Engineering Viewpoint, Proceedings of the 17th Annual Conference of the Nigerian Society of Chemical Engineers, Port Harcourt, 1987, Nov. 11-14, p. 41-61.
3. Ofurhie M. A., Managing the Nigerian Natural Gas Industry in the Next Millennium, Nigerian Society of Chemical Engineers Proceedings, 1999, 29, p. 177-188.
4. Sawchuk B. D., Sawchuk D. P, Flow Conditioning for Natural Gas Measurement, Acadiana Flow Measurement Society, 23rd Annual Show, April 15-17, 2002.
5. Kuye A. O., Computer Software for Designing/Calibrating Head Meters, Proceedings of the 20th Annual Conference of the Nigerian Society of Chemical Engineers, Nov 7-11, 1990, p. 89-114.
6. Kuye A., Sanni L. O, Modelling Sorption Isotherms of Lafun and Soyflour Using a Spreadsheet, International J. of Food Properties, 2002, 5(3), p. 599-610.
7. ISO 5167-1: 1991 (E), Measurement of Fluid Flow by Means of Pressure Differential Devices Part 1: Orifice Plates, Nozzles and Venturi Tubes Inserted in Circular Cross-Section Conduits Running Full.
8. ISO 5167-1: 1991/amd. 1: 1998 (E), - Amendment 1
9. Ikoku C. U., Natural Gas Production Engineering, John Wiley & Sons, N. Y, 1984.
10. American Gas Association, Orifice Metering of Natural Gas, Gas Measurement Committee Report No 3, New York, January 1956.
11. American Gas Association, Gas Engineer’s Handbook, Industrial Press, New York, 1965.