Spreading of Oil Spill on Placid Aquatic Medium
Derrick O. NJOBUENWU* and Millionaire F. N. ABOWEI
Chemical/Petrochemical Engineering Department, Rivers State University of Science & Technology, PMB 5080 Port Harcourt, Nigeria
donadviser@gmail.com, profmfnabowei@yahoo.com
Abstract
Continuous
research in the development of suitable predictive model is vital as the input
of oil spills into the aquatic environment particularly in the Niger Delta area
of Nigeria is alarming due to frequent oil spills. This eventually
affects aquatic organisms and shoreline activities. This work developed an semi-empirical
expression that can predict the horizontal spreading of Niger Delta Oil Spills
(NDOS) on a placid water body using simple physical coefficients of the oil and
the aquatic medium. The empirical expression developed is a function of the spreading
coefficient which was derived from heuristic arguments and enhanced to deal
with gravity, viscous and surface tension forces. The extent of spread of various
oil samples was found to correlate with non-dimensional groups comprised of the
ratios of the product between density, viscosity for oil and water
respectively. This model provides an easy means to
estimate oil slick transport under stagnant water conditions at specific
locations in the Niger Delta area. The semi-empirical model is verified against
most popular empirical model.
Keywords
Spreading; Oil spill; Niger delta; Aquatic medium; Oil pollution; Calm water; Oil properties.
Introduction
The Niger Delta as defined by Nigerian Government extends over about 70,000 km2 and makes up 7.5% of Nigeria’s land mass. It includes land in Abia, Akwa Ibom, Bayelsa, Cross River, Delta, Edo, Imo, Ondo and Rivers States. These sates produce the oil and natural gas that make up to 75% of Nigerian foreign exchange earnings. The exploration of the petroleum results to oil spillage with attendant pollution problems. Niger Delta Oil Spills has received growing attention by scientists and environmentalist, over the past decades, as a consequence of a number of accidents (operational discharges, accidental discharges, blow-out of offshore oil wells, or when a pipeline breaks, ship wreckages, sabotage, etc) involving the release of large amounts of oil in Niger Delta water bodies.
Various oil spills in Niger Delta have resulted to river pollution, extinction of some species of fishes and other aquatic organism in the area used for food and direct motility of aquatic organisms and birds. In response to such accidents government agencies and civil authorities usually prepare oil spill constituency plans [1,2]. An important component of these plans is the use of mathematical models for tracking the oil spilled movement and predicting its short- and long- term fate, the condition and amount of oil that remains at the water. Considerable work has been advanced towards understanding and quantifying the spill transport and fate processes, necessary for model development. The fate and transport mechanisms are affected by the contaminant characteristics, which vary with the different oil; by various physical, chemical and biological processes; and by the prevailing aquatic environment conditions.
According to reviews on the state-of-the-art in the oil spill simulation [3-6], the first studies attempting to model the movement of oil slicks [7-12] consider the spreading as one-dimensional or axi-symmetric. These models consider the spreading of the oil in calm waters, where an oil slick, initially circular, will remains circular, but increasing its diameter. Different analytical models have been suggested based on theoretical knowledge of the relevant processes and several semi-empirical models are available for simulation of the oil slick spreading and drifting on water [13].
Spreading of oil spill on water is the horizontal expansion of the oil spill due to gravity, inertia, viscous and surface tension forces [14]. Spreading is one of the most significant processes during the early stages of an oil spill in water, increasing the overall surface area of the slick, thereby enhancing mass transfer via the evaporation and dissolution processes [12,15]. This tendency for an oil spill to spread depends on two physical forces acting together: the force of gravity that causes the oil to spread horizontally and the surface tension of the substrate (water), which is usually greater that that of oil film floating on water, also causes the oil spill to spread [8]. Gravity and surface tension will promote the spreading of oil on a calm sea surface while inertia and viscosity will retard spreading [8,9].
Fay [8] identified the basic mechanisms in the mechanical distribution of oil on the aquatic surface using a simple one-dimensional model. Fay further illustrated there mechanisms by dimensional analysis that there are three stages in the spread of initially concentrated volumes of oil on a calm sea. Immediately after the spill, the oil slick is rather thick. Therefore, in the first phase, gravity and inertia forces dominate the spreading process with gravity being the accelerating force and inertia the retarding force. As time progresses, the oil slick becomes thin and inertia forces become relatively unimportant. In the second phase, the gravity and viscous forces dominate the spreading with the viscous force being the retarding one. As the slick gets thinner, interfacial tension forces become important. A third phase is reached in which interfacial tension and viscous forces dominate the spreading.
In order to predict the spreading of Niger Delta Oil Spills discharged into a placid aquatic environment, a new comprehensive empirical model, based on the physical characteristics of the oil and the aquatic medium, such as viscosity, density, surface tension; the volume of oil discharged into the aquatic environment; and the spreading rate force is presented. The model considers the spreading in the regime when the inertial and viscous forces counterbalance gravity.
Experimental
An experimental system illustrated in Figure 1 is designed and assembled for the investigation of spreading of raw Niger Delta oil samples on a placid water surface. The experimental setup includes a laboratory open water channel measuring 500 cm in length, 8 cm in width and 145 cm in depth in which a measuring tape is mounted. At the end of one side of the water channel there is an oil dam in the form of a funnel of radius 2.5 cm. The channel is initially filled with fresh water obtained from Nun River in Niger Delta of Nigeria and left for about 30 minutes in order to a ensure stagnant water surface. The collected river water was typical of a tropical coastal area. The oil dam containing a predetermined quantity of raw Nigeria samples was gently withdrawn to enable the oil slick to spread over the stagnant water surface. The spreading of each oil sample was determined with the aid of a stop watch and tape measure.
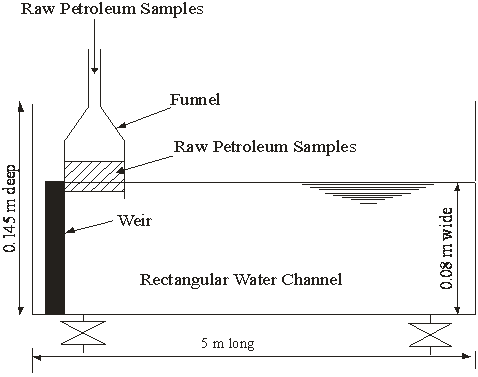
Figure 1. Schematic Diagram showing the Laboratory Open Channel for the Determination of Spreading of Niger Delta Oil Spills on Placid Aquatic Medium
The experiment was repeated several times with a varying volume of spill. It is believed that a major component of a spill model’s precision lies in accurate measurement of the physical properties of the oil and water. Hence, we performed a number of laboratory analyses on the crude oil samples and the river water to generate the parameters necessary for our model to confidently calculate oil spill behaviour. Modified ASTM methods for testing density, viscosity and surface tension of both water and three blends of Niger Delta of Nigerian oil samples from various flow stations (pipeline locations where crude oil from wells in the field are gathered before they are sent to processing) were used [14]. The oil was mixed at varying proportion to obtain three samples with varying physical properties of interest.
Results and Discussion
The experimental results for selected physical properties of the oil samples and water are shown in Table 1. The result from the spreading experiment is shown in Figure 2. The figure shows a sample of experimental measurement for oil sample I spreading on placid aquatic regime. Similar graphs were plotted for oil samples II and III and the fitted parameters obtained were used in the formulation of the model. Those graphs were intentionally omitted to avoid redundancy of the figures since they behaved similar to Figure 2.
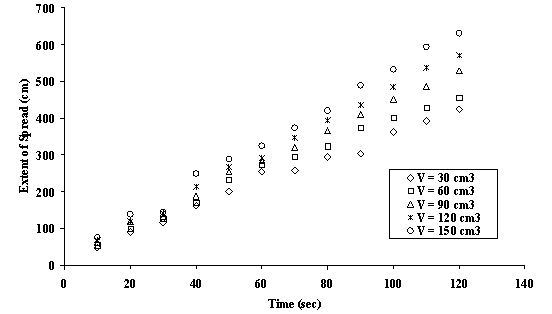
Figure 2. Extent of spread - Time Graph for Oil Sample I spilled on Water at various Volumes
From the experimental results shown in Figure 2, the extent of spread R(t) obeyed the power law with respect to time as follows:
|
|
(1) |
where t is time, and n is the power law exponent while m is the pre-exponential constant; and the m is volume dependent constants for each of the oil samples used. The values of n and m were fitted parameters by regression technique using data in plotted graphs. The coefficient n was deduced from the results to be independent of oil sample and spill size and is approximately 0.87. The value of m varies linearly with different oil samples and volume of oil spilled V on the water surface.
Table 1. Properties of oil Samples at Room Temperature
|
Oil Samples |
Density (g/cm3) |
Viscosity (g/cm.s) |
Surface Tension of Oil (g/s2) |
Surface Tension of Oil/water (g/s2) |
|
Sample I |
0.88053 |
0.063833 |
38 |
29 |
|
Sample II |
0.8751 |
0.027944 |
31 |
38 |
|
Sample III |
0.9 |
0.071667 |
39 |
28 |
|
Fresh Water |
0.997 |
0.011667 |
74 |
- |
A plot of m against volume of oil spilled V was made for each oil sample in Figure 3. The graphs were observed to be linear with similar slope of approximately 0.33 at varying intercept. Therefore, from Figure 4, a general correlation model is proposed.
|
m = K + ФV |
(2) |
The following results in the form of equation (2) were obtained for the three oil samples investigated:
|
Sample I: m = 8.61 + 1/3 V Sample II: m = 5.24 + 1/3V Sample III: m = 2.30 + 1/3V |
(3) |
The value of Ф was evaluated to be approximately 0.3333 while K was observed to vary with oil properties. The magnitude of K varies with the ratio of the viscosity of the oil sample to that of the aquatic environment. Thus,
|
|
(4) |
Using linear regression, the computation gives a linear relationship with R-Square value > 0.99 of the form:
|
|
(5) |
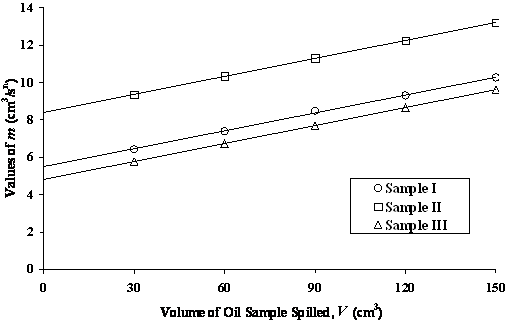
Figure 3. Relationship Between m in Equation (2) and Volume of Oil Spilled V on Water

Figure 4: K Dependence on the Ratio of Viscosities, ![]() ,
Equation (5)
,
Equation (5)
The data obtained as seen in Figure 4 show that β = 11.23 and ƒ = -1.07. Substituting equation (5) into equation (2) and further substitution of the result into (1) gives
|
|
(6) |
where: β = 11.23; ƒ = -1.07; χ = μo/ μw; n = 0.8; Ф = 1/3;μ is viscosity with subscript o for oil and w for water. On substitution of the values and constants gives the extent of spread as:
|
|
(7) |

Equation (7) does not contain the spreading force of the spreading oil which is the first parameter to characterise the fate of the first weathering process [14]. The spreading rate force or coefficient of oil on placid aquatic medium is a function of the surface tension of the oil and is used to determine the rate at which oil spreads over the sea surface. This parameter determines whether the oil will spread once discharged into the sea. A positive spreading rate force signifies the oil will spread and vice visa [16].
If a quantity of raw oil slick is placed on an aquatic surface at constant pressure and temperature, so that initially oil is present on a monolayer (thin organic films of a thickness of a few nanometres) of appreciable thickness, then the free surface energy is given as:
|
G = U - T S |
(8) |
where U is the internal energy, T is the absolute temperature, and S is the entropy.
|
dG = dU - d(TS) = (TdS - PdV) - (TdS + SdT) = - PdV - Sdt |
(9) |
At constant temperature, dT = 0; then, dG = -PdV ; where - PdV represents the work done on the system (it is only one kind of work, but stands here for them all, everything but heat). In the present case, the work in making new surface of area dA at constant temperature is γ dA, thus,
|
dG = γ dA : γ = dG/dA |
(10) |
γ is the free energy per unit area of new surface. Dimensionally, this is erg/cm2, dyne/cm, nN/m or g/s2. For the air-water, air-oil and oil-water interfaces therefore, the total energy is given as [16]:
|
|
(11) |
|
|
(12) |

in which component w constitute the substrate (water), o the spreading oil and G the free surface energy. Substituting equation (12) into (11), gives:
|
|
(13) |

Simplifying equation (13) gives:
|
|
(14) |

The surface tension of water, oil and oil-water interface respectively expressed in terms of free surface energy in form of equation (5) as [16]:
|
|
(15) |

Substituting equation (15) into (14) gives spreading coefficient as determined from the free surface energy as [14]:
|
|
(16) |
Surface tension of immiscible liquids (oil-water) γow is given as [14,16]:
|
|
(17) |
Substituting equation (17) into (16), gives:
|
|
(18) |
where α is a constant and is determined experimentally. Equation (18) expresses the spreading coefficient S in terms of oil and aquatic environment surface tensions. To incorporate other factors, the constant α in equations (17) and (18) is determined by fitted parameters from experimental data using the physical properties of three Niger Delta of Nigerian oil samples and fresh water shown in Table 1. From Figure 5, α is determined as
|
|
(19) |

α in equation (19) compared well with the experimental values as shown in previous work [14]. Substituting equation (19) into (18) yields:
|
|
(20) |

From equation (12),
|
|

Substituting the last equation into (7) yields
|
|
(21) |

Equation (21) is the new comprehensive empirical model for the prediction of the spreading of a finite quantity of oil spill on a placid aquatic medium.

Figure 5. Relationship between Constant α and the Ratio of Densities – Viscosities, Equation (11)
It can be noted based on the experimental values of the oil samples and fresh water in Table 1 that using Equation (16) the oil samples has a positive spreading force so the oil will spread on the water phase due to surface tension forces. A negative value would indicate that the oil will not spread by surface forces on water [14, 15, 17].
A significant observation shows that the extent of spread at constant volume is dependent on oil properties. This characteristic behaviour is more remarkable with viscosity variation. The oil sample II with smaller viscosity exhibited higher extent of spread. The higher the viscosity of the oil, the greater the tendency for the oil to remain stationary. As the crude oil spreads, it quickly loses its volatile and water-dissolved components, and the remaining viscous fractions retard the spilling process; thus, the specific gravity of an oil spill can increase as the lighter substances within the oil evaporate. The higher the oil’s surface tension, the more likely a spill will remain in place. If the surface tension of the oil is low, the oil will spread even without help from wind and water currents. Because increased temperatures can reduce a liquid’s surface tension and viscosity, oil is more likely to spread in warmer waters than in very cold waters. The analysis shows that the oil sample II with lower surface tension spreads faster than others at the same condition.
The first step in validating a model is to compare with available analytical solutions. For this problem the semi analytical solution of Fay are adequate. Physical validation requires field measurements. As was already mentioned, Fay’s results describe the spreading of an instantaneous spill in calm waters. Figure 6 reveals that the results obtained from the computation of the developed predictive empirical models compared well with those obtained from the experimental investigation and Fay’s gravity-viscous spreading regime model [9].
The major difference of this model, Equation (21), as compared to other used semi-empirical models, is that this model is more generalized by the inclusion of other functional parameters (surface tension, density and viscosity of the oil spilled and the aquatic environment and the spreading force). This feature increases compatibility of the oil spill model with the modern hydrodynamics and ecological models. Another advantage of the model lies on a tread to use only physically relevant parameters whenever possible to increase a range of model application for different spill scenarios and environment conditions
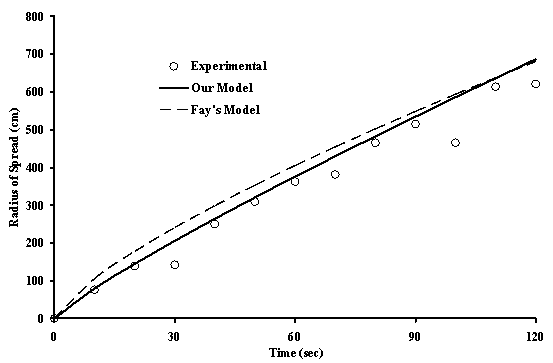
Figure 6. Comparative Analysis of Experimental Determined Extent of Spread, Fay’s Model and the Developed Model for Predicting the Extent of Spread
Conclusions
The study has focused on the sensitive parameters that may directly or indirectly influence environmental evaluations relating to the spread of an oil spill in water for biological, social and economic effects. The main conclusions from the study are:
1. The spreading rate forces or coefficient S is a key parameter in calculating the area coverage and mass balance.
2. S is currently constant, but should vary with the viscosity of the oil and the water (and thereby with the oil type and its surface tension formation properties).
The result of this work is applicable to one-dimensional spreading of oil spill in stagnant water body. The result from the model compares well with the laboratory data and the works of Fay as shown in Figure 6. Efficiency of the empirical algorithms proposed here for predicting pollutant transport can be greatly enhanced if the sensitive independent parameters are correctly utilized and measured and if the water is at quiescent conditions. The sensitive independent parameters include physical properties of oil spills, aquatic environment and the quantity of a spill.
References
[1]. Abowei M.F.N, Prediction and consequences of petroleum spills into the Nigerian aquatic environment in the year 2000, International J. Environment & Pollution, 1996, 6(2,3), p. 306-321.
[2]. Njobuenwu D.O., Amadi S.A., Dagde K.K., Marine Oil Spill: Contingency Planning, Response and Clean-Up Strategies, Int’l J. Sci. & Tech., 2005, 2(4), p. 36-43.
[3]. ASCE, State-of-the-Art Review of Modeling Transport and Fate of Oil Spills, ASCE Task Committee on Modeling of Oil Spills of the Water Resources Engineering Division, J of Hydraulic Engineering, 1996, 122 (11), p. 594-609.
[4]. Huang J.C., A Review of the State-of-the-art of Oil Spill Fate/Behavior Models, Proc. of 1983 Oil Spill Conf., Washington, DC, 1983, p. 313-322.
[5]. Reed M., Johansen O., Brabdvik P.J., Daling P., Lewis A. Fiocco R., Mackay D. Prentki R., Oil Spill Modelling Towards the Close of the 20th Century: Overview of the State-of-the-art, Spill Science and Technology Bulletin, 1999, 5(1), p. 3-17.
[6]. Spaulding M.L., Oil spill trajectory and fate modelling: state-of-the-art review, Proc. of 2nd Int. Oil Spill R&D Forum, IMO, London, UK, 1995.
[7]. Blokker P.C., Spreading and Evaporation of Petroleum Products on Water, Proc. of 4th Int’l Harbor Congr., 1964, p. 911-919.
[8]. Fay J.A, The Spread of Oil Slicks on a Calm Sea, In: Oil on the Sea (D.P. Hoult Ed.) Plenum Press, New York, 1969, p. 53-63.
[9]. Fay J.A., Physical Processes in the Spread of Oil on a Water Surface, Proc. Joint Conf. on Prevention and Control of Oil Spills, API, Washington D. C., 1971, p. 463-467.
[10]. Fannelop T.K., Waldman G.D., The dynamics of Oil Slicks or Creeping Crude, AIAA 9th Aerospace Sciences Meeting, 1971, AIAA Paper p. 71-74.
[11]. Hoult D.P., Oil Spreading on the Sea, Annual Review Fluid Mech., 1972, p. 341-367.
[12]. Jeffery P.G., Large Scale Experiments on Spreading of Oil at Sea and it’s Disappearance by Natural Factors, Proc. Joint EPA, API, USCG Conf. on Prevention and Control of Oil Spills, 1973, p. 469-474.
[13]. Yapa P.D., Shen H., Angammana K., Modeling Oil Spills in a River-Lake System, J. Marine Science, 4, Elsevier, 1994, p. 453-471.
[14]. Njobuenwu D.O., Modelling Spreading Rate Force of Petroleum Spill on Placid Aquatic Medium, J Sci. & Tech. Research, 3(3), 2004, p. 48-52.
[15]. Clark R. C., MacLeod W. D., Inputs Transport Mechanisms and Observed Concentrations of Petroleum in the Marine Environment. In: D.C. Malins Ed. Effects of Pet. on Arctic and Sub arctic Marine Environ. & Organisms, Academic Press, New York, 1977, pp. 91-223.
[16]. Adamson A.W., Gast A.P., Physical Chemistry of Surfaces, 6th Ed., Wiley-Interscience, New York, 1997.
[17]. Susu A.A., Abowei M.F.N., Onyeme J.O., Oil Spills in Marine Environment, CJC Press Ltd Lagos, Nigeria, 1997, p. 499.