Neuronal Classification of Atria Fibrillation
Mohamed BEN MESSAOUD
Electronic and Information Technology Laboratory. National Engineering School of Sfax, BP W 3038 Sfax, Tunisia. Phone: +216-74 274 088 Fax: +216-74 275 595.
E-mail: M.BenMessaoud@enis.rnu.tn
Abstract
Motivation. In medical field, particularly the cardiology, the diagnosis systems constitute the essential domain of research. In some applications, the traditional methods of classification present some limitations. The neuronal technique is considered as one of the promising algorithms to resolve such problem.
Method. In this paper, two approaches of the Artificial Neuronal Network (ANN) technique are investigated to classify the heart beats which are Multi Layer Perception (MLP) and Radial Basis Function (RBF). A calculation algorithm of the RBF centers is proposed. For the Atria Fibrillation anomalies, an artificial neural network was used as a pattern classifier to distinguish three classes of the cardiac arrhythmias. The different classes consist of the normal beats (N), the Arrhythmia (AFA) and Tachycardia (TFA) Atria Fibrillation cases. The global and the partition classifier are performed. The arrhythmias of MIT-BIH database are analyzed. The ANN inputs are the temporal and morphological parameters deduced from the electrocardiograph.
Results. The simulation results illustrate the performances of the studied versions of the neural network and give the fault detection rate of the tested data, a rate of classification reaching the 3.7%.
Conclusion. This system can constitute a mesh in a chain of automated diagnosis and can be a tool for assistance for the classification of the cardiac anomalies in the services of urgencies before the arrival of a qualified personal person.
Key words
ECG; Classification; Artificial Neural Network (ANN); Multi-Layer Perceptron (MLP); Radial Basis Functions (RBF).
Introduction
The activity of the heart is recorded by electric signals on the surface of the body at specific points, which constitute Electrocardiogram (ECG). The ECG is the most studied biomedical signal to characterize the cardiac anomalies [1]. The normal rate of heartbeat is composed by waves, in general, dependent on the mechanical actions of the heart. The P-wave represents auricular depolarization. The complex QRS corresponds to ventricular depolarization preceding the mechanical effect of contraction, the wave R is of a great amplitude because the mass of the ventricles is higher than that of the auricles. The T‑ wave represents the repolarization of the ventricles. Lastly, the wave U, not constant, translates the repolarization of the network of Purkinje [2]. In general, the traces of cardiac anomalies are appeared in one or more parameters related to the ECG waves. Algorithms of assistance to the diagnosis, the identification or the automatic classification of the anomalies are developed in these last years using the familiar data processing methods in the medical field. Varied techniques were used for the classification of the cardiac arrhythmias; one can excerpt the correlation method [3], the fuzzy logic technique [4-6], or neural networks [7, 8, 31], and the Vectors Supports Method [9]. In this paper, we are interested in the classification of the arrhythmias presenting some anomalies. The MIT-BIH database is the source of the examined data [10]. The studied anomalies are Arrhythmia (AFA) and Tachycardia (TFA) Atria Fibrillation. The normal cases will be arranged in a third class. Since the Artificial Neural Network (ANN) has the property of a universal approximation, this technique is has to be applied. Two algorithms of the ANN will be applied; the structure of direct propagation “feedforward”, namely the model Multi-Layer Perceptron and the model containing the Radial Basis Functions. These methods are used by [6, 11-13]. The fundamental difference between these methods is that RBFs are local models whereas MLPs are not. Moreover, in the RBF structure, the training is decomposed into three independent stages of less complexity. So, its use on line is more practical. After the phase of de-noising the signals, the significant parameters characteristic of the ECG are extracted and the classification of the signals by both of the suggested structures are performed. From the result of classification, the limits and the fields of application of each configuration are discussed.
The Paper is organized in five parts including this section. Section 2 points out the waves of the ECG and their practical significances as well as the anomalies to that will be classified. The preprocessing of the data which consists of denoising and Parameter extraction of the ECGs is will be treated in section 3. In section 4, we will discuss the implementation of the neuronal classifier under his traditional version and containing Radial Basis Function. The results of simulation will be discussed at the end of the paper.
Waves of the ECG and their practical significance
The recording of the temporal evolution of the electric field resulting from the electric activity of the heart is called the electrocardiogram. The ECG is carried out by the electrodes on a standard paper. The frontal and horizontal plans represent the members’ derivations and the precordials’ derivations respectively. The width of 1 mm is equivalent to a duration of 0,04 second and in the height 1 mm corresponds to 0,1 mV (usually the voltages are expressed in millimeters).
Characteristics of the ECG
The ECG can be divided generally into three principal components P-wave, QRS complex and T-wave as shown in figure 1. These waves are related to the activity of the auricles and the ventricles in the form of activation or recuperation. The contraction of the heart muscles (of the heart) produces a visible wave of depolarization in the layout of the ECG and the return to the state of the rest constitutes a wave of repolarization represented by an iso-electric voltage constituting the line base.
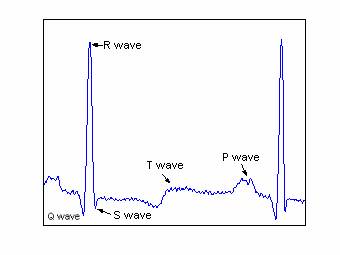
Figure 1. Waves of the ECG
The frequencies of each wave present some variations according to the rate of heartbeat. The change of the rhythm of the beat is called Arrhythmia. The frequency band of the ECG signal is approximately 60 Hz for a normal subject and can go up to 130 Hz for an abnormal patient. Table 1 gives the actions of the membranes of the heart in the Normal case and the associated waves like their temporal and frequencies characteristics [3, 14].
Table 1. Mechanical and electrical characteristics of a normal arrhythmia
|
Mechanical actions |
associated Wave |
Duration (ms) |
Amplitude (mV) |
wave Frequency (Hz) |
|
Auricular depolarization |
P wave |
80-120 ms |
≤ 0.3 mv |
10 |
|
Depolarization of the ventricle |
QRS Complex |
85-120 ms |
Q<0 - S>0 R (0.5-2) |
20-50 |
|
Repolarization of the ventricles |
T wave |
200 ms |
0.2 mV |
5 |
|
Repolarization of the auricles |
Hidden wave |
|
|
|
Utility of the Electrocardiograms
The ECG allows the detection and the analysis of many cardiac diseases. It also makes it possible much more precisely to study the auricular P wave [15] and ventricular T ones [16]. The slowly heart beats are the Bradycardia and the accelerated rhythm corresponds to the Tachycardia. The Ventricular Tachycardia is marked following a scar of a former heart attack. Auricular Fibrillation describes completely chaotic activation in the auricles. In this case, the production of the fluctuations is irregular in the line base whereas complex QRS remains normal.
Data processing
Filtering of the ECGs signals
During the recording of the signals of electrocardiography, different standards from noises can be superimposed on the useful signal. If some sources can be avoided, (precision and drifts of the measuring instruments), others cannot be (the rate of respiration and the frequency of the electric supply network). The pre-treatment of ECG signals imposes the suppression of these perturbation signals, the noise high frequency electromyography and the low frequency drift. The extraction of the useful signal from the noisily signal(,) was treated by various methods in frequencies (or), in temporal field [17-20] or in time frequency domain [21, 22].
The temporal methods are based on filtering by low pass filter and high pass one in cascade. In general, this method has a problem of calculation precision (accuracy of coefficient is in order of 10-9) or of a very high power of coefficient reaching 256. Also, this type of filter introduces a considerable delay into the resulting signal, Moreover, it slightly modifies the form or/and the amplitude of ECG waves. If this type of filtering can be used in the case of the QRS detection [14], it cannot be applied for the diagnosis due to the amplitude deformation. The time frequency methods, based on the Discrete Wavelet Transform and using the coefficient threshold (soft or hard), which are proposed by Donoho and Al [23, 24] are frequently applied to denoising signals [25, 22, 26]. This type of filtering causes the phenomenon of pseudo Gibbs in the waves Q and S [26, 28].
In this work, the method adopted for denoising the ECGs is to decompose the ECG signal in approximations and details by the Discrete Wavelet Transform, then to retain a reduced number of signal details. These details constitute a band passes filter, which allows the elimination of the high frequencies and the setting of the signal in line base. The major advantages of this method are the conservation of the geometrical characteristics of the initial ECG and the suppression of the impulse noises. For the studied signals, which are sampled in 360 Hz, one break up the ECGs signals into eight (7) levels of decomposition. To eliminate the high frequencies, one cancels the details D1, D2 until DL. In this case, L is fixed at 3. To find the line base which constitutes the state of the rest of the heart, the very low frequencies are cut. In this case, A7 component, from frequency lower than 1,406 Hz, is eliminated. The range of the frequencies retained of the filtered signal is thus between 360/27 and 90 Hz. Figure 2 gives an example of filtering of a signal ECG. It is noticed that the line base is obtained and the high frequency noise is eliminated.
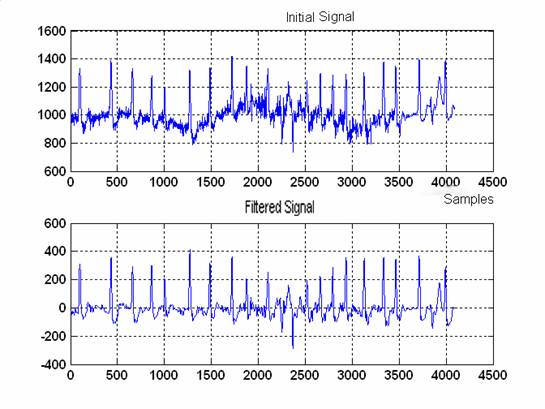
Figure 2. Signal ECG of MIT 203 (a) original signal disturbed and presenting a deviated line base (b) filtered signal after elimination of the details components D1, D2 and A3.
Extraction of the Parameter settings
The precision of the results of classification of the anomalies depends on the adequate choice of the parameters relating to each class. To select these parameters, a consultation of the experts (in general a doctor) is necessary. A redundancy of information can appear if one chooses a high number of parameters; moreover, the network requires the use of an important number of neurons [8]. On the other hand, a reduced number of parameters cannot distinguish the classes. Various characteristics are extracted from the ECGs for the classification of the ventricular arrhythmias using complex QRS and the segment ST: the rate of heartbeat, the spectral characteristics, the coefficient of AR, the measurements of complexity and the measurements of non-linear. In [29], 12 parameters are selected including the waves’ areas. In [30], in addition to the traditional parameters (area, amplitude and duration), information morphologies are deployed, and the number of parameters reaches 26.
Neuronal classification
Principle
Classification is one of the techniques mostly used in medicine. It constitutes the principle of several systems of assistance to the diagnosis. The classification consists of assigning an object (recordings of the electrocardiograms, encephalograms …) to a class according to a defined descriptor. This description is related on the properties or typical specific conditions to the classes. The objects are then classified whether they check or not these conditions or properties. Zong and Jiang [29] applied fuzzy logic for the classification of the cardiac anomalies. On the other hand, Hu and Al [8], employed the neuronal technique. In our contribution, the neuronal technique is used to validate the system of classification suggested.
An artificial neural network is a mathematical model for the data processing based on a connectionist approach. In the classification, the most used configurations are the Multi-layered Perceptron (MLP) using the retropropagation method of the gradient (BP) as a training algorithm and the networks with cores using the Radial Basis Function (RBF) as a transfer function of the hidden layer neurons. Our attention is fixed on their application in the classification of ECGs. The task is accomplished in two stages: the stage of training and that of test. The recordings of test and validation used for the analysis and classification are obtained from the MIT-BIH database “AF Termination Challenge Database (aftdb)”, “MIT-BIH Atrial Fibrillation Database (afdb)” and “MIT-BIH Normal Sine Rhythm Database (nsrdb)” [10]. A total of 94 recordings is analyzed. They consist of 82 from the patients presenting an auricular fibrillation including 23 tachycardia and 59 arrhythmias and 12 normal cases. Most PhysioBank databases include one or more sets of annotations for each recording. Annotations are labels that point to specific locations within a recording and describe events at those locations and their classes [10]. These data are divided arbitrary into two sets of training and test groups. The training set has 44 cases in the first group (AFA) and 16 tachycardia cases in group 2 (TFA) and 7 other cases. The test is composed of 15 cases of the type AFA, 7 cases of TFA and 5 normal cases. The sampling rate of the signals is fixed at 360 Hz. For the cases taken by different frequencies, we proceed by pretreatment of the signal.
Figure 4 summarizes the classification steps of the signals. One distinguishes the stage of data Conditioning (sampling and filtering), the stage of extraction of the characteristics and the stage of neuronal classification (training of the data and validation of the test data).
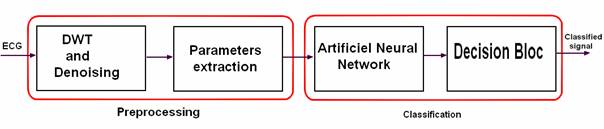
Figure 4. Stages of classification of a signal ECG by neural network
Multi-Layer Percetron MLP
To solve nonlinear problems of classification, various network topologies of neurons with powerful strategies of study were discussed. For the current application, a multi-layer network with only one hidden layer is used (called a network of three layers). The output layer includes one neuron, which can take the values of “1”, “2” or “3” indicating the order of the ECG class. During the phase of training, output neuron compares its calculated activation with its value wished to determine the associated error and then adjusts the synaptic weights in order to minimize the quadratic error. The algorithm of retropropagation is usually used for the adjustment of the weights between layers. This algorithm suffers from the slowness of training; in off-line training, this does not present a handicap, but on-line training requires fast algorithms to follow the system dynamics. The local minima as well as the divergence of the procedure of training are the second major disadvantage of neural network synthesis. The retropropagation algorithm of the error ensures the adjustment of the parameters described by the equation (1) where the additive term of wij represents the variation of the adjustment in the direction of the gradient, k is the iteration number, and a is the training factor:
|
wi,j(k+1) = wi,j(k) + α∙δj∙zi + μ[wi,j(k)-wi,j(k-1)] |
(1) |
where: zi is the hidden layer i, δj the output error in the layer j and μ the momentum parameter.
RBF Network with cores
Alternatively, with network MLP and for the same types of applications of classification or approximation of the functions, the RBF network constitutes other method based on the approach of classification by the cores. The RBF Network consists of three layers: the input layer, the radial hidden layer and the output linear layer. The activation of the neurons of the hidden layer is obtained from the distance which separates the inputs from the centers. The inputs space is covered by a set of cores where the activity zones overlap. The cores often used are the Radial Functions. Figure 5 illustrates the principle of RBF network of dimension two.
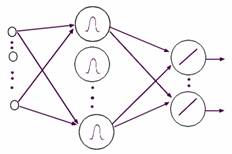
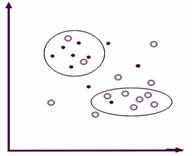
(a) Network architecture. (b) Separation of the areas.
Figure 5. RBF Network with two dimensions
The training phase consists of two stages: The phase of the selection of the standard deviation s and the centers of RBFs. The selection of width and centers can be determined by SVM method or randomly [9]. We present a methodology of choice of the centers based on the following algorithm:
|
►Construct a matrix M of distance: each element of the matrix gives the distance separating two items I and J; that Mij = dist (I, J) I, j=1… N, the Euclidean distance is adopted in this application. ►Choose the nearest point to the origin as centers C1, ►Group the elements according to their vicinity in groups Gk= {Xik}, one takes as criterion of proximity the “average of the matrix of the distances”/√ 2. ►Choose a center among Xik of each group. |
This algorithm is applied to calculate the centers Ci. According to [33], the standard deviation s will be determined as the following:
|
|
(2) |
The second stage is the calculus of the weights between the hidden layer and the output. This problem consists in solving a system of linear equations where the solution can be determined by the least square method and consequently the training is faster than MLP network.
Application of the neural network to the ECGs classification
Data processing
The pretreatment of ECG signals implies the suppression of the line interference of the network, the electromyographic high frequency noise and the low frequency drift, described in detail in Christov and Bortolan [34]. The ECGs signals were filtered using a filter passes band [1,407 - 90 hertz] based on DWT as described in the paragraph (§ 3). The filtered signals were sampled with 360 hertz. The input vector of dimension four, normalized between 0 and 1, is used as an input of the neural network for the classification of recordings ECG of the beats of the heart.
Simulation of the classifiers
The first network that we have tested is the multi-layer perceptron
MLP of neuron by using the global solution. The method of training is the
retropropagation of the gradient. We built a network with three layers: 4
neurons in the input layer constituting the parameters resulting from the stage
of the data parameter extraction, 4 neurons in the hidden layer where the
activation function is the hyperbolic tangent function (![]() )and an output neuron
of linear transfer function giving values 1, 2 or 3 as number of the class. The
second network is the probabilistic one PNN which is a RBF network and which
takes in the phase of training as cores all the data of training when the data
are limited (in this case to 67 centers). The same data are tested by network
RBF where s is chosen as 0.35 and the third of the average of the coefficients
value of matrix distances as criterion of space of the individuals. The
selection of the centers was carried out by the algorithm described above; 23
groups are deduced in which one element of the group is chosen to constitute
the centers. Figures 6, 7, 8 and 9 illustrate the result of simulation during
the phases of training (‘o’ mark) and test (‘+’ mark) for various architectures
MLP, PNN and RBF.
)and an output neuron
of linear transfer function giving values 1, 2 or 3 as number of the class. The
second network is the probabilistic one PNN which is a RBF network and which
takes in the phase of training as cores all the data of training when the data
are limited (in this case to 67 centers). The same data are tested by network
RBF where s is chosen as 0.35 and the third of the average of the coefficients
value of matrix distances as criterion of space of the individuals. The
selection of the centers was carried out by the algorithm described above; 23
groups are deduced in which one element of the group is chosen to constitute
the centers. Figures 6, 7, 8 and 9 illustrate the result of simulation during
the phases of training (‘o’ mark) and test (‘+’ mark) for various architectures
MLP, PNN and RBF.
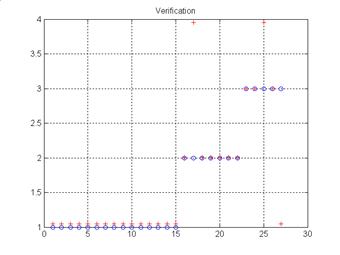
Figure 6. Result of test of MLP network
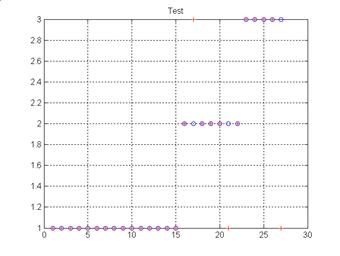
Figure 7. Result of test of PNN network with 67 centers
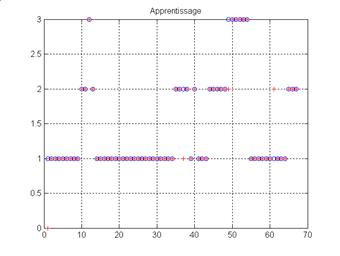
Figure 8. Result of training of network RBF (23 centers)
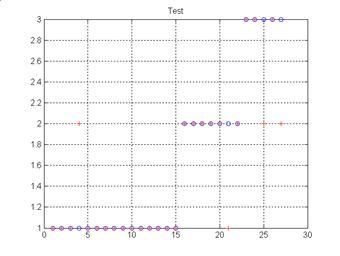
Figure 9. Result of test of network RBF (23 centers)
Evaluation of the results
To evaluate the performance of different presented methods, the sensitivity criteria defined in equation (3) is used [33]:
|
|
(3) |
where: TP: true positive, TN: true negative, FP: false positive, FN; false negative and U: uncertain.
Another index of performance can be applied which is called “Rate of False Detection'' (FDR) and which is largely used in medical field. Rather than to measure the chance to have positive cases which are false, the FDR measures the rate of false detection. The FDR is defined in the equation (4).
|
|
(4) |
The measure of the homogeneity of the examples by the Entropy is defined by the equation (5).
|
|
(5) |
where p (positive example) is the number of classified examples, and n (negative example) is the number of not classified examples of the N examples.
If the entropy is “0”, then all the examples belong to the same. If the entropy is “1”, then there are as many positive examples of negative examples.
In the following, the phase of the test is performed. The performances of the classifiers by class are summarized in table 2. The sensitivity is given as an indication while the FDR will be used as comparison criterion.
Table 2a. Performance of the test phase of different networks (a) Test MLP
|
|
Studied cases |
classified |
Not classified |
FDR(%) |
Se(%) |
Entropy(%) |
|
1st Class |
15 |
15 |
0 |
3.7 |
93.75 |
0 |
|
2nd Class |
7 |
6 |
1 |
3.7 |
100 |
59.17 |
|
3rd Class |
5 |
3 |
2 |
7.4 |
100 |
97.10 |
|
total |
27 |
24 |
3 |
11.1 |
96 |
50.33 |
Table 2b. Performance of the test phase of different networks (b) Test PNN
|
|
Studied cases |
classified |
Not classified |
FDR(%) |
Se(%) |
Entropy(%) |
|
1st Class |
15 |
15 |
0 |
7.4 |
88.2 |
0 |
|
2nd Class |
7 |
5 |
2 |
7.4 |
100 |
86.31 |
|
3rd Class |
5 |
4 |
1 |
7.4 |
80 |
72.19 |
|
total |
27 |
24 |
3 |
11.1 |
88.9 |
50.33 |
Table 2c. Performance of the test phase of different networks (c) Test RBF
|
|
Studied cases |
classified |
Not classified |
FDR(%) |
Se(%) |
Entropy(%) |
|
1st Class |
15 |
14 |
1 |
7.4 |
93.3 |
35.34 |
|
2nd Class |
7 |
6 |
1 |
14.8 |
75 |
59.17 |
|
3rd Class |
5 |
3 |
2 |
7.4 |
100 |
97.10 |
|
total |
27 |
23 |
4 |
14.8 |
85.2 |
60.52 |
Simulation results show that networks MLP gave a percentage of higher sensitivity and a rate FDR smaller than the structures RBF and this during the phases of training and test, in spite of the reduced number of the neurons in the hidden layer. This is why we choose this configuration to build the network of classification per partition having 4 inputs, 7 neurons in the hidden layer and 3 output neurons which represent the classes AFA, TFA and N as shown in figure 10.
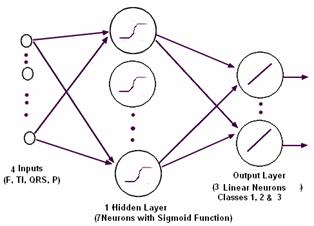
Figure 10. Network of neuron of classification by partition
The results of classification using the “partition” neuronal classifier are summarized in table 3. .
Table 3. Approach PMC with three classes
|
|
Studied cases |
classified |
Not classified |
FDR(%) |
Se(%) |
Entropy(%) |
|
1st Class |
15 |
14 |
1 |
3.7 |
93.3 |
35.34 |
|
2nd Class |
7 |
6 |
1 |
3.7 |
100 |
59.17 |
|
3rd Class |
5 |
2 |
3 |
3.7 |
100 |
97.10 |
|
total |
27 |
22 |
5 |
18.52 |
95.7 |
69.13 |
In this case, the sensitivity is higher and the rate of false detection is weaker than “total classification”. Indeed a case among the 27 samples of test is badly classified. The performances of the neural network of classification are considered to be acceptable comparatively with the manual tests (of the expert). This approach can constitute a tool of assistance for the diagnostic or the classification of some cardiac anomalies.
Conclusion
In this paper, various structures of classifier neuronal were studied, in order to compare their ability of classification. The networks tested are the Multi-Layer Perceptron and the Radial Basis Functions network. The comparison criterion of the performances is the Rate of False Detection. To apply the RBF network, we developed a calculation algorithm of the centers. After the phases of training and test, the Multi-Layer Perceptron gave results of classification of the cardiac signals more satisfactory than the RBFs network. Moreover, the number of neuron in the hidden layer of a RBF network is higher (23 or 67 in this case) than a MLP network (4 only). The sigmoid neurons act on a wide area of the input space, whereas the radial neurons cover restricted areas of space. In opposition, the training of RBF network is faster. However after the choice of the centers, the calculation of the weights results from a matrix inversion. It is judged that if the database is extended, the results of RBF network become better than with MLP version. In this second case the algorithm of retropropagation can be instable. Moreover, the RBF networks are not adapted for the recursive algorithms of training of the weights which make its generalization less flexible. The partition classification network is also tested. The simulation results of classification are better than previously. This system can constitute a mesh in a chain of automated diagnosis and can be a tool for assistance for the classification of the cardiac anomalies in the services of urgencies before the arrival of a qualified person.
References
1. Maurice Algazi and Philippe Meurin, L’électrocardiogramme Guide pratique, Biopharma 2000, Paris.
2. Hampton J. R., L’ECG Facile,Sixième édition, EDISEM, Maloine 2004.
3. Ramli A.B. and Ahmad P. A., Correlation analysis for abnormal ECG signal feature extraction, 4eme conf. On telecom. Technologies proceedings, Malaysia, 2003.
4. Adlassnig K.P., Fuzzy set theory in medical diagnosis, IEEE Trans. on Systems, Man, and Cybernetics, SMC, 1986, 16(2), pp. 260-265.
5. Liu Jiancbeng Cao Wei, Analysis of ECG R Waves using Adaptive Wavelets Transforms with Fuzzy-Logic, 3eme Intern. Conf. on Computational Electromagnetics and Its Applications Proc., 2004.
6. Silipo R., Bortolan G. and Marchesi C., Fuzzy preprocessing and artificial neural network classification for the diagnostic interpretation of the resting ECG, Computers in Cardiology, 10-13 Sept. 1995, pp. 365-368.
7. Nyongesa H. et all, Classification Of ECG By Auto-Regressive Modelling And Neural Networks, IEEE AFRICON, 2004, pp. 841-841.
8. Hu Y. H., Tompkins W J., Urrusti J. L. and Afonso V. X., Applications of artificial neural networks for ECG signal detection and classification, Journal of Cardiology, 1994, 26, pp. 66-73.
9. Graja S. and Boucher J. M., SVM Classification of patients prone to atrial fibrillation, WISP 2005, September 1-3, Faro, Portugal.
10. Harvard-MIT Division of Health Sciences and Technology Biomed. Eng. Center, MIT-BIH Arrhythmia Database, http://www.physionet.org/physiobank/database/mitdb.
11. Atoui H., Fayn J. and Rube P., A Neural Network Approach for Patient-Specific 12-Lead ECG Synthesis in Patient Monitoring Environments, Computers in Cardiology, 2004, 31, pp. 161-164.
12. Pang S., Credit Scoring Model Based On Radial Basis Function Network, IEEE Int. Worksho Sulin Pangp VLSl Design & Video Tech, Suzhou, China, May 28-30, 2005.
13. Blu T. and Unser M., Wavelets, Fractals, and Radial Basis Functions, IEEE Transactions On Signal Processing, 2002, 50(3), pp. 543-553.
14. Schuck A. and Wisbeck J. O., QRS Detector Pre-processing Using the Complex Wavelet Transform, Proc. of the 25 Annual Intern. Conf. of the IEEE EMBS, Cancun, Mexico September 17-21, 2003.
15. Maglaveras N., et al., Analysis of Atrial Fibrillation after CABG using Wavelets, Computers in Cardiology, 2002, 29, pp. 89-92.
16. Jekova I., Comparison of five algorithms for the detection of ventricular fibrillation from the surface ECG, Physiol. Measur, 2000, 21, pp. 429-439.
17. Fokapu O. and Girard J.P., Evolution temporelle et fréquentielle de l'ECG : analyse battement par battement, ITBM, 1994., 14(1), pp. 102-112.
18. Chouakri S.A., Bereksi-Reguig F., Ahmaidi S. and Fokapu O., Wavelet Denoising Of The ECG Signal Based On Noise Estimation, 5th International ISAAC Congress, July 25-30, 2005, Catania, Sicily, Italy.
19. Chouakri S.A., Bereksi-Reguig F., Ahmaïdi S. and Fokapu O., Wavelet Denoising of the Electrocardiogram Signal Based on the Corrupted Noise Estimation, Computers in Cardiology, 2005, 32, pp. 1021-1024.
20. Afonso V., Tompkins W.J., Nguyen T.Q. and Luo S., ECG beat detection using filter banks, IEEE Trans. on Biomedical Engineering, 1999, 46, pp. 192-202.
21. Kestler H.A., Haschka M., Kratz W., Schwenker F., Palm G., Hombach V. and Hohe M., De-noising of High-resolution ECG Signals by Combining the Discrete Wavelet Transform with the Wiener Filter,Computers in Cardiology, 1998, 25, pp. 233-236.
22. Agante P. M. and Marques de Sa J. P., ECG noise filtering using wavelets with soft-thresholding methods, Computers in Cardiology, 1999, 26, pp. 523-538.
23. Donoho D. L. and Johnstone I. M., Adapting to unknown smoothness via Wavelet shrinkage, Technical Report, Department of Statistics, Stanford University, 1992.
24. Donoho D. L., De-noising by soft thresholding, IEEE. Trans. Infomation Theory, 1995, 41, pp. 613-627.
25. Qin S., Yang C., Tang B., and Tan S., The denoise based on translation invariance wavelet transform and its applications, A Conference on Structural Dynamics, Los Angeles, 2002, 1, pp. 783-787.
26. Su Li and Zhao Guoliang, De-Noising of ECG Signal Using Translation- Invariant Wavelet De-Noising Method with Improved Thresholding, Proc. 27th Ann. Conf. of the IEEE Eng. in Medicine and Biology, Shanghai, China, September 1-4, 2005.
27. Hamilton P. S. and Tompkins W.J., Quantitative investigation of QRS detection rules using the MIT BIH arrhythmia database, IEEE Trans. Biomed. Eng., 1986, 33, pp. 1157-1165.
28. Adddison P.S., Wavelet Transformer and the ECG : a review, Physiol. Meas., 2005, 26, pp. 155-199.
29. Zong W., Jiang D., Automated ECG rhythm analysis using fuzzy reasoning, Proc. of Computers in Cardiology, 1998, pp. 69-72.
30. Christov I., Jekova I. and Bortolan G., Premature ventricular contraction classification by the Kth nearest-neighbours rule, Physiol. Meas, 2005, 26, pp. 123-130.
31. Silipo R., Zong W. and Berthold M., ECG Feature Relevance in a Fuzzy Arrhythmia Classifier, Computers in Cardiology, 1999, 26, pp. 679-682.
32. Pan J. and Tompkins W. J., A real time QRS detection algorithm, IEEE Trans. Biomed. Eng. BME, 1985, 32, pp. 230-236.
33. Gao D., Madden M., Chambers D. and Lyons G., Bayesian ANN Classifier for ECG Arrhythmia Diagnostic System: A Comparison Study, Proc. of Intern. Joint Conference on Neural Networks, Montreal, Canada, July 31 - August 4, 2005.
34. Christov I. and Bortolan G., Neural networks for pattern recognition parameters ranking in premature ventricular contraction classification, Physiol. Meas, 2004, 25, pp. 1281-1290.