Theoretical and Experimental Study of Multi-Phase Flow in the Intake Port of a Port Fuel Injection Engine
Fathollah OMMI*, Ehsan MOVAHEDNEJAD and Kouros NEKOFAR
Faculty of Engineering, Tarbiat Modares University (TMU), Tehran, Iran
Iranian Space Agency (ISA), Tehran, Iran
E-mails: fommi@modares.ac.ir, movahed@yahoo.com, nekofar@yahoo.com
(*Corresponding author)
Abstract
For spark ignition engines, the fuel-air mixture preparation process is known to have a significant influence on engine performance and exhaust emissions. In this paper, a one-dimensional, unsteady, multiphase flow has been modeled to study the mixture formation process in the intake manifold for a port-injected gasoline engine. In addition, an experimental study is made to characterize the spray characteristics of a Multi-hole injector used in the engine. One-dimensional airflow and wall fuel film flow and a two dimensional fuel droplet flow have been modeled and it includes the effects of in-cylinder mixture back flows into the port. As a result, predictions are obtained that provide detailed picture of the air-fuel mixture properties along the intake port. In addition, comparison was made on injection characteristics of the multi-hole injectors and its effects on multi-phase flow property on various fuel pressures and temperatures.
Keywords
Multi-Phase Flow; Port Injection Engine; Injector; Intake Port
Introduction
Ever increasing rate in the production of fuel injection vehicles and the significance of decreasing the pollutions in nature trigger numerous researches in optimizing the fuel injection system and recognizing the fuel behavior as well as the process of preparation of mixtures in the inlet port of fuel injection vehicles using MPFI system.
One of the main factors in a complete combustion and hence for contaminations and in the engine performance is the generation of a homogenous mixture of air and fuel in the cylinder. Therefore, the most possible fuel should be evaporated in the ports and mixed with the inlet air and the less possible fuel as a liquid layer should be formed at the port and the cylinder walls. To reach this goal, it is essential to recognize the structure and spray pattern. It is also important to know the time and condition with which the fuel should be sprayed in the port. The process of forming mixture in gasoline fuel injection vehicles is initiated with the spray of fuel from injector and accompanied with the process of mass and momentum transmission. The droplet of fuel, which exhausted from the injector having different size, average velocity and trajectory, determines the pattern and structure of spray as well as the performance of injector. These characteristics are dissimilar in the various time of injection and different injectors and can be determined using the design and operation specifications. Different parameter in spay like atomization specification, spay pattern, appropriate angle and variation through different cycle have a great influence on the engine performance [1].
Better understanding of spay specification for the indirect spray injector has a significant role in designing efficient spay parameter for different engine operation conditions. Therefore, comprehensive investigation on these injection systems has been accomplished [2-7].
Numerous researches are performed on optimizing the formation of mixture regarding the injector operating parameter and port geometry design. [8-11]. Many of these researches ignored the influent of interaction between different phases in the manifold or inlet port. They also assumed a uniform velocity profile. Others supposed a single part fuel and hence they disregarded the effect of diffusion. In 1996, Gang Chen investigated the mixing process of fuel and air in addition to the interaction between three phases of gas, droplet and liquid layer by modeling a multiphase, transient flow in the fuel injection engine [8]. The purpose of this research was to understand the characteristics and spray pattern of injector and to investigate multiphase flow in the ports of injection engine XU7JPL3 using MPFI. Therefore, initially the characteristic and spray pattern of injector was measured using PDA (Phase Doppler Anemometry) and then this information used to model the spray process. Next, the engine is simulated by considering the inlet air from air valve to the outlet gas from exhaust pipe. The accuracy of modeling is validated using the information acquired from hot test of engine getting from dynamiter apparatus in the condition of maximum load and for the velocity interval of 2600 to 6000 rpm and using the information of comparison between engine pressure curve, volumetric efficiency and momentum. The results show a satisfactory agreement with the experimental data of the engine. Using data from engine test, the opportunity of calibrating and using this model in different load operating conditions is investigated.
Governing equations and numerical model
The Wave software is a one-dimensional gas dynamics code, which is used to analyze the dynamic pressure wave, mass flow and energy losses in different systems. The software procedure is based on using the reciprocal pressure wave motion through the system and their reflection from the open or closed ends and computing the pressure and temperature of the flow. This software is also able to simulate the compressible flow in different volumes, ducts, pipes, orifices and using different boundary conditions as surrounding. In addition, it can generate different kinds of plots corresponding to different parameters of engine.
The software can predict the spray process, the distribution and evaporation of droplets and the fuel layer formation and transmission in the port using the governing equations of motion and droplet evaporation. It has two models for simulating of the fuel evaporation. In the first model, the liquid fuel, entering the cylinder, is considered to evaporate with a higher pressure than the vapor mixture pressure. If there is a condition in which the saturated vapor pressure above the liquid fuel surface drops below the mixture vapor pressure in the cylinder, the fuel condenses to the liquid state again. In this software, the evaporation rate is computed using an initial estimation for SMD (Sautr Mean Diameter) and the characteristic evaporation time according to the below mentioned model.
![]() (1)
(1)
in that, mv and ml
are the vapor and liquid fuel masses,![]() is calculated using the energy balance between air and liquid fuel.
is calculated using the energy balance between air and liquid fuel.
In the second model, the spray motion of liquid fuel in two forms of droplet displacement and liquid layer as well as their evaporation throughout the flow path are predicted. The SMD is obtained using Hiroyasu equation for the low-pressure spray and the below mentioned equation. [12]
![]() (2)
(2)
![]() and
and ![]() are the dynamics viscosity of fuel and gas. We
and Re are Weber and Reynolds number respectively.
are the dynamics viscosity of fuel and gas. We
and Re are Weber and Reynolds number respectively.
In this model, the droplet is considered to have a uniform size equal to the SMD or a nonuniform distribution according to Rosin & Rammler, 1993 function. In the pressure simulation, Rosin & Rammler function is used. It is also assumed that the fuel layer have a uniform temperature distribution. The droplet evaporation rate is obtained using the follow formula (Bird, 2002):
![]() (3)
(3)
which DAB is the permeability of gas, Sh* is Shroud number and BM is the mass transfer number which is defined as:
 (4)
(4)
where Yfs and ![]() are the mass
fraction of vapor fuel at the droplet surface and the surrounding.
are the mass
fraction of vapor fuel at the droplet surface and the surrounding.
The formula for the exchange of heat between droplet and surrounding can be stated as:
 (5)
(5)
Where the first term corresponds to the heat transfer rate and the second term presents the required heat for the evaporation of droplet.
The gas temperature is computed using Chen & Yuen formula:
![]() (6)
(6)
In the spray model, using the present software, the location and angle of injector on the port and the location and angle (to predicts collision type) of jet collision on the port are considered as the inputs. Then the software can predict the surface covering from the fuel layer and the different regime emerging from the hitting of droplets to different surface and valve.
The droplet regime of collision after hitting is dependent on the characteristics of the surface like velocity, size, collision angle, temperature, surface roughness, fuel layer thickness and physical property of fluid, which is determined by Weber and Laplace number.
The evaporation rate of fuel is calculated regarding the following formula in which hD is mass transfer coefficient and BM is mass transfer coefficient.
![]() (7)
(7)
The heat equilibrium (thermal equilibrium) relationship is as follow:
![]() (8)
(8)
The right first, second and third terms are considered as the heat transfer rate between the layer and surrounding gas, the required heat for the evaporation and the heat transfer rate between the wall of port and the layer.
The combustion model, in this software, is a transient thermodynamics model (of cylinder process) based on solving mass and energy equilibrium assuming a model for two combustion zones in which the cylinder is divided in two parts: burned and unburned.
The mass equations determine the mass variation in the cylinder as a consequent of mass transfer from the valves and fuel spray and can compute the mass flow rate of passing air, evaporated fuel, liquid fuel and product. The energy equation governing unburned part can be express as:
muluul–mu0uu0+mulRulTulPVu0+Qu![]() muihui=0 (9)
muihui=0 (9)
The energy equation for the burned part can also be presented as:
mb1ubl-mb0ub0+mblRblTblPVb0+Qb+![]() mbihbi=0 (10)
mbihbi=0 (10)
The total volume of cylinder is considered to be the sum of burned and unburned parts.
MulRulTul+mblRblTbl–PVC=0 (11)
Equations 1, 2 and 3 are solved using Newton repetitive method. In the combustion model, the combustion of pre-mixture is modeled using Wiebe function in which the combustion rate of mixture is described using thermodynamics relationship.
In the Wiebe function, the mass fraction of burned parts in mixture is considered as a function of crankshaft angle as follow [13]:
 (12)
(12)
Where w is the mass fraction of burned part. BDUR is considered between 10 to 90 percent of burning degree. wexp is the power of Wiebe function and AWI is a parameter which is internally defined. In this model, the burning rate is control using three parameters, which is defined by the user.
These parameters can be defined as:
1) The degree belonging to the 50 percent of burning in the heat release curve
2) The burning interval between 10 to 90 percent
3) The Wiebe function power that affects the burning interval.
Modelling of Injector
The model, used for the injector, is a pulse width model in which injector spray diagram defining the mass of free fuel versus pulse, is entered by the user. This data is obtained using the engine hot test in the specific velocity and load regarding the engine fuel consumption and the width of spray pulse.
The required information for the modeling of injector are: 1) fuel temperature, 2) nozzle diameter 3) SMD 4) the angle of spray cone 5) the initial velocity of fuel 6) the curve of spray 7) the starting time of spray versus crank angle 8) the width of spray pulse. These data are obtained from the characteristic of spray using PDA apparatus.
Measuring the spray characteristics
The PDA measures the spray characteristic using Doppler frequency difference phenomena. This devise is constituted of a laser production source, two detectors of reflected light from the droplet surface and a processor. It can measure different parameters like mean diameter, SMD, particle velocity in two directions, amount of turbulence, the percentage of roundness and the droplet concentration in a volume.
The detectors using fringe or the dark and bright plane, which is formed by the Gaussian distribution of light intensity at the interference of two laser beams with similar frequency, perform the Doppler frequency measurement.
These planes which are
vertical to the plane of two beams are formed as a parallel layers. When
a moving particle is passing though a bright plane, a reflection appears and by
passing through a dark plane no reflection can be detected. Having the distance
between the Fringes distance and measuring the frequency of reflected light,
the particle velocity vertical to the interference plane is equal to ![]() [14].
[14].
In the PDA apparatus, the measuring of particle dimension is performed by comparing the received signals by two light detectors, which have different angular position with respect to the measured volume. These two received signals have different phase due to the discrepancy in their optical path emerging from different direction after passing from the particle or reflecting from its surface. This phase difference is linearly proportional to the diameter of a particle. By measuring the phase discrepancy of the two detectors which located at the direction of two beams, it is possible to calculate the diameter of particles.
The described PDA which is able to measure the velocity at two directions has a double laser beams with the blue and green colors as it is shown in figure 1.
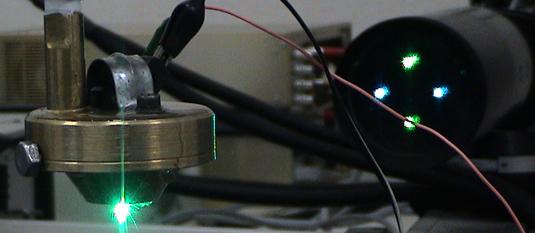
Figure 1. A view of laser beams which is coincident with each other in a point at the measured location
The blue beam is located in a horizontal plane while the green is placed on the vertical plane. These beams are used to measure the velocity in two vertical and horizontal planes. The measuring is performed by computing the average of 1500 droplets during 15 seconds. Regarding this procedure, it is not necessary to repeat the experiment.
The experiment is performed for the point located at the vertical plane of spray axis at the out let of nozzle and having a 10-centimeter distance from the nozzle, which is the space between the spray plane and inlet of nozzle for the predefined engine and it, is considered in the calculations.
The defined spray is a spray with electric ball vale with multi- flow. By opening this valve, the main fuel is passed through the initial nozzle and collides with the center of a plane, which has a hole around it. Then, it is divided to three separated jets (figure 2). The cross section area of spray cone is converted to an elliptical shape by receding from the nozzle. In figure 2, the shape of spray with three dissimilar jets is shown.
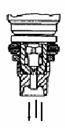
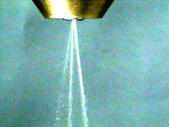
a b
Figure 2 a. The geometry of spray nozzle, b. the spay pattern in the tested injector
In figure 3, the axial velocity distribution is demonstrated in a plane perpendicular to the spray axis and in the 100mm distance from the nozzle. As it can be seen from the figure, there are three high velocity regions indicating three separated jets having different mass flow rates, in another word, different powers. The velocity of the most powerful jet is about 2 times bigger than the weakest one.
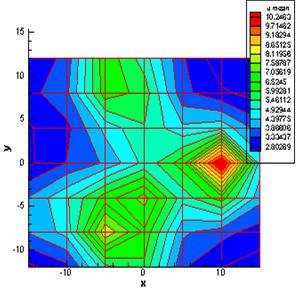
Figure 3. The axial velocity distribution in the 10 cm distance from the nozzle
In figure 4, the mean diameter distribution is presented which is the least at the center of spray cone and by moving around, the diameters become bigger.
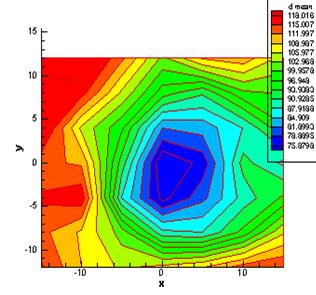
Figure 4. The droplet means diameter distribution at the distance of 10 cm
Figure 5. The percentage of droplet dimensional distribution at the distance of 100 mm from the nozzle (after gate vale) and the 300 KPa pressure
One of the most important factors in determining the spray structure and its characteristic is the frequency distribution curve of the droplet versus dimension indicating the droplet distribution in the spray mixture. This curve, which is used to determine the droplet distribution after inlet gate valve, and a 100mm distance from the nozzle as well as at the 300 KPa pressure, is demonstrated in figure 5. In this figure the horizontal and vertical abscissa, indicate particle diameter and frequency respectively.
The summary of results for using the model in presented in table 1.
Table 1. The characteristic of spray at the injector in different fuel pressure and 25-degree temperature
|
500 |
400 |
300 |
200 |
Fuel pressure (KPa) |
|
16.1 |
14 |
13.1 |
11.9 |
Initial mean velocity (m/s) |
|
71.5 |
74.3 |
77 |
81 |
Sautre Mean diameter (Micron) |
|
11.3 |
9.9 |
8.39 |
6.99 |
Injection rate (kg/hr) |
|
24 |
20 |
15 |
11 |
Spray cone angle |
Calibration of the model
After simulation of the engine, it is essential to evaluate the accuracy of the modeling and the agreement between the model and the experiments by regulating some of the parameters, which is applied using engineering judgment. To reach this goal, the parameters like volumetric efficiency, maximum pressure in the cylinder, air fuel ratio, and momentum and exhaust temperature are adjusted and the simulation results for the condition of specific load, velocity interval of 2600 to 6000 rpm is compared with the results of engine hot test using a dynamometer. In figure 6, the volumetric efficiency and momentum of the model in the velocity interval of 2600 to 6000 rpm is compared with the experiments.

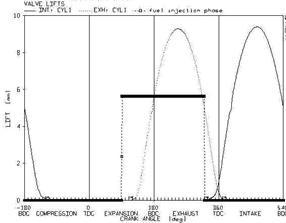 Figure 6. Comparison
of volumetric efficiency and momentum of mode with the results of hot test
Figure 6. Comparison
of volumetric efficiency and momentum of mode with the results of hot test
Results
In this section, to have a better picture of fuel and air mixing process and the interaction of multi phase in the intake port, some of the numerical results are studied for the velocity interval of 2600 to 6000 rpm and the full load. The characteristics of inlet air from the intake port with the diameter of 35mm and length of 100mm is presented in the table 2. In figure 7, the interval of opening and closing of gate valves and spray injector is demonstrated. At all curves, the opening and closing of air intake gate valve are indicated as IVO and IVC and the opening and closing of air outlet gate vale are also presented with EVO and EVC respectively.
Table 2. The specification of inlet air from the port in the full load
|
Intake wall temperature |
Intake manifold pressure |
Intake charge temperature |
Initial gas velocity |
Velocity (rpm) |
|
360 (k) |
0.862 (bar) |
304 (k) |
50 (m/s) |
2600 |
|
460 (k) |
0.806 (bar) |
299 (k) |
113 (m/s) |
6000 |
Figure 7. The time of opening the gate valve and injector at the velocity of 2600 rev/min
In figure 8, the variation of mass ratio of the air in the port throughout a cycle in presented. At the time which the inlet gate valve is closed, the mass ratio of air is constant. By stating the spray process, it decreases. This decline continues after the opening of inlet air gate vale because the burned gasses from previous cycle returned to the port and reaches its minimum at the closing time of exhausted gate valve.
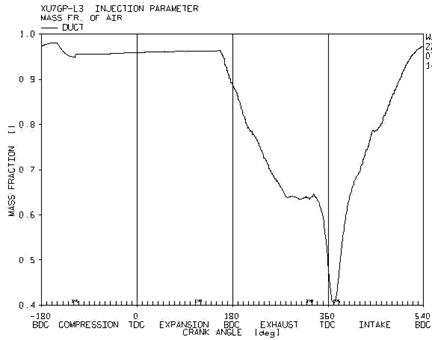
Figure 8. the variation of mass ratio of air at the inlet port in a cycle with the velocity of 2600 rev/min
Then, by entering the air in the port, the mass ratio increases and continues before the closing time of inlet gate valve. At this time, the mass ratio decreases because there is some returned flow to the ports.
In figure 9, the mass ratio of vapor fuel at the ends of inlet ports is presented for a 2600 and 6000 velocity magnitude.
It is apparent that at the velocity of 2600, at the beginning of spray process, in the exhaust stroke, the mass ratio of vapor increases. This trend results from the obligatory evaporation of fuel layer in the port and continues until the middle time of intake stroke. Then the mass ratio of vapor decreases and continues until the closing time of intake gate valve. At the end of intake stroke, regarding the presence of returned flow, a vast majority of vapors in the cylinder is returned to the inlet port. Comparing this figure considering higher velocity (6000 rpm), it can be seen that, at the time of spraying the fuel, the amount of vapor is a bit more because the walls of the port are warmer and the air velocity is higher. The lack of enough time for the evaporation of fuel at the higher velocity prevents high amount of fuel to be evaporated. A more important point is that at the high velocity less amount of vapor is returned to the port because less returned flow presents and hence, the amount of vapor mass ratio after closing the inlet valve in much less than the amount of the mass for the low velocity. In figure 10, the variation of mass ratio for the film and fuel droplet (liquid phase) at the ends of the port is presented considering the velocity interval of 2600 and 6000 rpm.
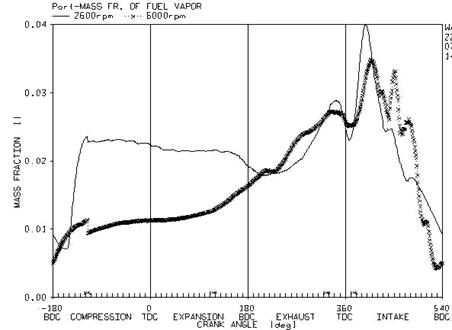
Figure 9. Comparison of vapor mass ratio inside the port at the velocity of 2600 and 6000 rev/min
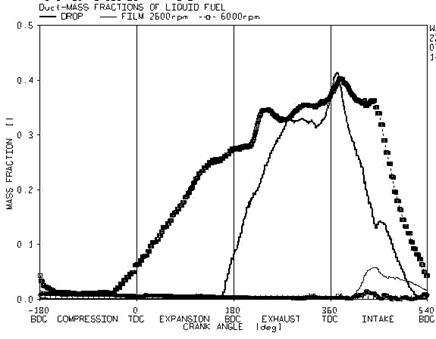
Figure 10. Comparison of film mass ratio and droplet in the port for the velocity of 2600 and 6000 rpm
The fuel film is formed at the wall after the spray finished. The apparent decline for film in the port and hence more evaporation of the film is a resultant of velocity increase. As it can be seen, at the revolution of 6000 rpm, the spray of the fuel so the generation of fuel droplet, starts prior to the velocity of 2600. Another important factor for understanding o the two-phase flow inside the port is the study of the trends in some parameters from the ends of manifold to the gate valve.
By passing the flow throughout the port and approaching the air gate valve, the pressure decreases and the velocity increases. The effect of returned flow at the beginning of the intake stroke, which the velocity decreases and its sign changes, continues to the inlet ports and more notable at the ends of stroke.
In figure 11, the variation of density for the air and vapor mixture is presented at the three sections of the ports. The coefficient of 0.16, 0.5 and 0.8 at the top of the figure is the distance percentage from the inlet point of the port. It can be observed that by moving to the ends of the port the mixture density decrease throughout the cycle. This decrease can be a consequent of increase in the temperature throughout the port.
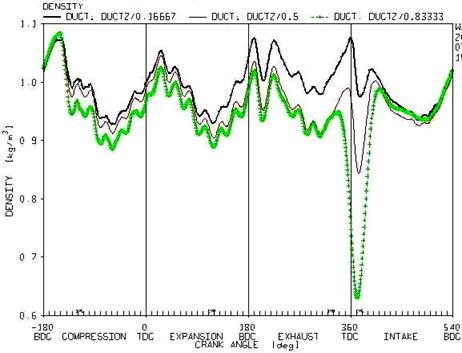
Figure 11. The variations in mixture density at the three sections of the port
One of the main factors in increasing the temperate along the port is the productions of vapour from the droplet of spay or from the fuel film surface. Therefore, to investigate the factor affecting the increase in the temperature at the port, it is necessary to study the vapour mass ratio inside the port in the three mentioned sections (figure 12).
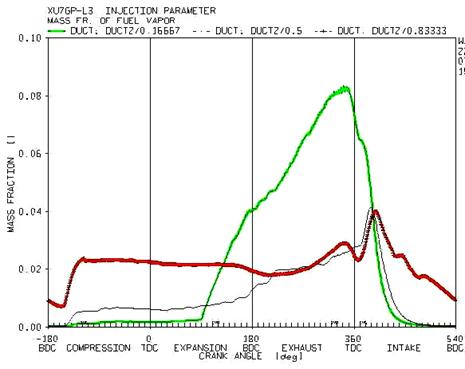
Figure 12. The variation of vapor mass ratio of the mixture at the three sections of the port
Regarding the figure 12 and the initial prediction, the amount of vapor generated in the mixture throughout the injection process, which is at the end of exhaust stroke, in the initial and intermediate regions is more than the ends of the port. This phenomenon is a result of a comprehensive evaporation in the droplet of fuel at the injection process. Considering the fact that the collision point of spray with the surface is located near the ends of the port, the most generated vapor from the fuel spray during injection occurs at the initial and intermediate region of the port, which leads to a decline in the temperature during these regions. It is notable that during this process, the air gate valve is closed and the air velocity is not high. A little after opening of the valve and in the second half of the intake stroke the difference in temperature decreases at the three sections. This state continues prior to the return of flow from the cylinder to the port. Considering the fact that some parts of air and superheated vapor mixture inside the cylinder returns to the port, temperature of mixture increases at the ends of the port and the density decreases. This condition continues to the re-injection of the fuel.
The increase in fuel temperature leads to the rise in fuel vapor pressure at the droplet surface and the fuel film. It is also noted that according to the equation 13 there is a linear relationship between the generation of the fuel vapor and saturated vapor pressure, therefore, by increasing the fuel temperature according to the equations 3 and 4, the mass transfer number and hence the evaporation rate of droplet increase. In addition, according to the equation 7, the evaporation rate for the fuel liquid film increases regarding the conversion and diffusion process.
 (13)
(13)
In this equation, Xfs is the fuel vapor mole fraction and Psat is the saturated vapor pressure of the fuel at the droplet surface.
This effect is notable due to the figure 13 in which the vapor mass ratio of the fuel at the ends of the port is presented versus different fuel temperature.
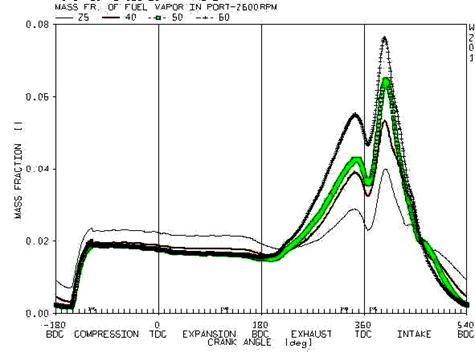
Figure 13. The variation of mass ratio of fuel vapour at the end of the ports versus different fuel temperature
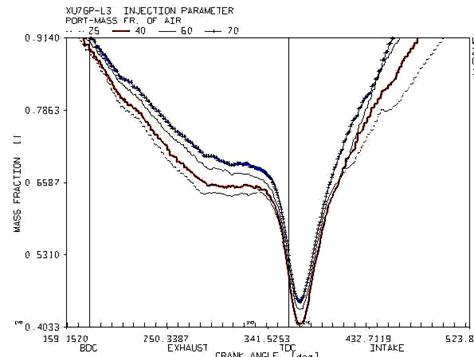
Figure 14. The variation of mass ratio of air at the end of the ports versus different fuel temperature at the intake and exhaust stroke
By injection of the fuel droplet in the port, the evaporation process starts form their surface, the required energy for evaporation is derived from the droplets and its surrounding air, and hence the droplet temperature decreases. In case the temperature of droplet is more than the surrounding air, the energy required for evaporation is derived only from the droplet and hence its temperature declines during a minor and reaches below the airport temperature before reaching the port surface. In this state, the temperature of liquid fuel film which is constituted the droplets gathering at the surface, is less than the initial state (fuel temperature is less than air) and hence the difference between the hot air port and cold fuel film increases. Therefore, by more heat transmission from the surrounding air to the fuel film, the air temperature decreases more than the initial state. In another word, by rising the temperature of the fuel to a specific limit, the temperature of gas mixture in the port declines. It is also known that the density and mass flow rate of mixture in the port is dependent on the temperature. The variation in the density of mixture directly affects the amount of inlet air to the cylinder and hence it can change the volumetric efficiency.
In figure 14, the mass ratio of air and fuel passing through the ends of the port in the intake and exhaust strokes of the engine is demonstrated versus the variation in the fuel temperature. The trend of passing air is ascending prior to the temperature of 60 and by increasing the temperature beyond this limit; it is changed to a descending trend. Therefore, it is predicted that the volumetric efficiency increase to the temperature of 60 degree and decrease afterwards.
References
1. Zhao F., Lai M.C., The Spray Characteristics of Automotive Port Fuel Injection - A Critical Review, SAE Technical Paper, № 950506, 1995.
2. Min Ren W., Sayar H., Influence of Nozzle Geometry on Spray Atomization and Shape for Port Fuel Injector, SAE Technical Paper, № 01-0608, 2001.
3. Lai M.C., Zhao F.Q., The Structure of Port Injector in Gasoline Engines, Proceedings of Advanced Spray Combustion (ISASC), Hiroshima, Japan, July 6-8, 79-89, 1994.
4. SAE Recommended Practice, Gasoline Fuel Injector, SAE J1832, 99-115, NOV89.
5. Chen S.K., Lefebvre A., Influence of Ambient Air Pressure on Effervescent Atomization, AIAA Journal, 10-15, 1993.
6. Jackson S.D., Williams P., Development of a Fuelling System to Reduce Cold-Start Hydrocarbon Emissions in an SI Engine, SAE Technical Paper, № 961119, 1996.
7. Quan Zhao F., Yoo J.H, the Spray Characteristics of Dual-Stream Port Fuel Injectors for Applications to 4-Valve Gasoline Engines, SAE Technical Paper, № 952487.
8. Chen G., Aggarwal A., Unsteady Multiphase Intake Flow in a Port-injected Gasoline Engine, SAE Technical Paper, № 960074.
9. Meyer R., Heywood J.B., Effect of Engine and Fuel Variables on Liquid Fuel Transport into the Cylinder in Port-Injected SI Engines, SAE Technical Paper, № 01-0563, 1999.
10. Amer A.A., Chue T.H., Zhao F.Q., Lai M.C., Modelling Turbulence Primary Breakup and Its Application in Director-Plate-Compounded Port Injectors, Proceedings of the eighth Annual Conference on Liquid Atomization and Spray Systems, ILASS-America, May 21-24, 1995.
11. Aggarwal S.k., Chen G., Vaporization Behavior of Fuel Droplets in a Hot Air Stream, International Journal of Heat and Mass Transfer, Vol. 30, pp 2669-2673.
12. Hiroyasu H., Shimizu M., the Break up of High Speed Jet in a High Pressure Atmosphere, Pres. The second int. conf. on liquid Atomization, USA, 1982.
13. Taylor C.F., The Internal Combustion Engine in Theory and Practice, vol. 1, 1985
14. Basic Principles of the Phase Doppler Anemometer, PDA User Manual, 55-66.