Fuzzy logic -based control of power of PEM fuel cell system for residential application
Khaled MAMMAR1, Abdelkader CHAKER2
1Departement of Electrical Engineering, Université of Bechar ,
Bp 417, Bechar, Algeria
2Department of Comuters and Informatics, Faculty of Electrical Engineering and Informatics,
2Laboratory of Electrical network, E.N.S.E.T,
E.N.S.E.T, B.P 1742 El M'naouar, Oran, Algeria.
E-mails: mammar.univ.dz@gmail.com, chaker@ecole.enset-oran.dz
Abstract
This paper presents a dynamic model of Fuel cell system for residential power generation. The models proposed include a fuel cell stack model, reformer model and DC/AC inverter model. Furthermore a fuzzy logic (FLC) controller is used to control active power of PEM fuel cell system. The controller modifies the hydrogen flow feedback from the terminal load. Simulation results confirmed the high performance capability of the fuzzy logic controller to control power generation.
Keywords
Polymer-electrolyte fuel cell, Dynamic model; Residential power; Fuzzy controller
Introduction
Proton in exchange membrane (PEM) fuel cells is one of the promising technologies for alternative power source of residential power generation in future. However, a fuel cell system is large, complex and expensive Designing and building prototypes is difficult and expensive. The alternative is modelling the fuel cell system for the simulation. The modelling of fuel cell is very important for power system, because it facilitates the understanding of the involved phenomena. Many models have been proposed to simulate fuel cells in the literature [1]-[6], which have generally each the own specificities and utilities, following the studied phenomena.
The model proposed in this paper includes the electrochemical and fluid dynamic aspects of chemical reactions inside the fuel-cell stack. Furthermore, voltage losses due to ohmic, activation, and concentration losses are accounted for. Therefore, this dynamic PEMFC model complements existing models such as the ones developed in [5], [6]. The model is suitable for power generation. To study the transient response of a grid-independent PEM fuel cell power plant, this paper proposes to an electrochemical model for a 30 kW fuel cell, which incorporates an external reformer to generate hydrogen from methane.
Fuel cells are dc voltage sources connected to electric power load through DC/AC inverters. A method to connect the Proposed PEMFC model to a grid-independent through an interface block is presented. The fuel-cell model, an external reformer and its interface block are implemented in MATLAB and incorporated with a power control analysis package.
Finally, a fuzzy logic based controller is designed for this purposes because of the numerous advantages it has high performance. Over the other types of controllers, the most important aspect being, the cost of the controller design and implementation. The proposed controller modify hydrogen flow for controlling active power to the load change
Fuel cell static model
Hydrogen PEM fuel cells transform chemical energy into electrical and thermal energy by the simple chemical reaction [1],[2],[3]
H2 + 1/2 O2 ![]() H2O
+ heat + electrical energy (1)
H2O
+ heat + electrical energy (1)
In order to get an electric current out of this reaction, hydrogen oxidation and oxygen reduction are separated by a membrane, which is conducting protons from the anode to the cathode side. The semi reactions on both electrodes are
H2 ![]() 2 H+ +
2 e-anode
2 H+ +
2 e-anode
O2 + 4 e- ![]() 2 O2-cathode
(2)
2 O2-cathode
(2)
While the protons are transported through the membrane, electrons are carried by an electric circuit in which their energy can be used. Modelling of fuel cells is getting more and more important as powerful fuel cell stacks are getting available and have to be integrated into power systems. In [5],[6]and [6] Jeferson M. Corrêa introduced a model for the PEMFC . The model is based on simulating the relationship between output voltage and partial pressure of hydrogen, oxygen, and currant.
The output voltage of a single cell can be defined as the result of the following expression [5], [6]:
![]() (3)
(3)
In (3), ENenst is the thermodynamic potential of the cell and its represents reversible voltage; Vact is the voltage drop due to the activation of the anode and of the cathode; Vohm is the ohmic voltage drop, a measure of the ohmic voltage drop associated with the conduction of the protons through the solid electrolyte and electrons through the internal electronic resistances; Vconc represents the voltage drop resulting from the concentration or mass transportation of the reacting gases [5]. The first term of (3) represents the FC open circuit voltage, while the three last terms represent reductions in this voltage to supply the useful voltage of the cell, , for a certain operating condition. Each one of the terms in (2) can be calculated by the following equations, using the parameters listed in Table I [6]:
Cell Reversible Voltage
The reversible voltage of the cell is calculated staring from a modified version of the equation of Nernst, with an extra term to take into account changes in the temperature with respect to the standard reference temperature, 30°C [5]
![]() (4)
(4)
where ![]() is the change in the free Gibbs
energy (J/mol); F is the constant of Faraday (96.487 C);
is the change in the free Gibbs
energy (J/mol); F is the constant of Faraday (96.487 C); ![]() is the change ofthe entropy
(J/mol); R is the universal constant of the gases (8.314 J/K mol); PH2
and PO2 while and are the partial pressures of hydrogen and oxygen
(atm), respectively. ariable T denotes the cell operation temperature (K) and
the Tref reference temperature. Using the standard pressure and
temperature (SPT) values for,
is the change ofthe entropy
(J/mol); R is the universal constant of the gases (8.314 J/K mol); PH2
and PO2 while and are the partial pressures of hydrogen and oxygen
(atm), respectively. ariable T denotes the cell operation temperature (K) and
the Tref reference temperature. Using the standard pressure and
temperature (SPT) values for, ![]() and
and ![]() , (4) can be simplified to [5]
, (4) can be simplified to [5]
![]() (5)
(5)
Activation Voltage Drop
As shown in [5], the activation over potential, including anode and cathode can be calculated by
![]() (6)
(6)
where Istack is the cell operating current (A), and the ξi ’s represent parametric coefficients for each cell model, whose values are defined based on theoretical equations with kinetic, thermodynamic, and electrochemical foundations [5]. Co2 is the concentration of oxygen in the catalytic interface of the cathode mol/cm, determined by
![]()
Ohmic Voltage Drop
The ohmic voltage drop results from the resistance to the electrons transfer through the collecting plates and carbon electrodes, and the resistance to the protons transfer through the solid membrane. In this model, a general expression for resistance is defined to include all the important parameters of the membrane.
![]() (7)
(7)
where Rc represents the resistance to the transfer of protons through the membrane, usually considered constant.
And.
![]()
ρM is the specific resistivity of the membrane for the electron flow ( cm), A is the cell active area cm and l is the thickness of the membrane (cm), which serves as the ectrolyte of the cell. The following numeric expression for the resistivity of the Nafion membranes is used [5]:
 (8)
(8)
where![]() the term is the specific resistivity (Ώ/
cm) at no current and at 30 C[5];
the term is the specific resistivity (Ώ/
cm) at no current and at 30 C[5];
Concentration or Mass Transport Voltage Drop
To determine an equation for this voltage drop, a maximum current density is defined, Jmax under which the fuel is being used at the same rate of the maximum supply speed. The current density cannot surpass this limit because the fuel cannot be supplied at a larger rate. Typical values for are in the range of 500–1500 mA/cm .
Thus, the voltage drop due to the mass transport can be determined by
 (9)
(9)
Where B (V) is a parametric coefficient, which depends on the cell and its operation state, and J represents the actual current density of the cell (A/cm) .The static model of the PEM fuel cell is shown in Fig.1, and the parameter are given in Table 1.
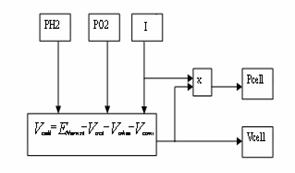

Figure 1. PEMFC static model
Table 1. Model parameters [5],[6].
|
Parameters |
Values |
|
T |
343K |
|
A |
333 cm2 |
|
L |
178 μm |
|
B |
0.016 V |
|
RC |
0.0003 Ω |
|
ζ1 |
-0.948 |
|
ζ2 |
0.00286+0.0002.lnA+(4.3.10-5)lnCH2 |
|
ζ3 |
7.6.10-5 |
|
ζ4 |
-1.93.10-4 |
|
Ψ |
23 |
|
Jmax |
1500 mA/cm2 |
|
Jn |
1.2 mA/cm2 |
Figure 2. A typical PEMFC cell voltage response surface .With simultaneous changes in the inlet partial pressure of hydrogen and current at a constant stack temperature of 70°
Figure 3. A typical PEMFC cell power response surface .With simultaneous changes in the inlet partial pressure of hydrogen and current at a constant stack temperature of 70°
Fuel Cell System Model
In [7], [8] and [9] Sharkh,Rahman,and Alam. introduced a model of PEMFuel cell system for residential power generation. This model has been modified to introduce a static model show in fig 1 the new model is shown in fig 4.
Fuel Cell Dynamic Model
This model is based on simulating the relationship between output voltage and partial pressure of hydrogen, oxygen, and current. A detailed model of the PEM fuel cell is shown in Fig. 4.
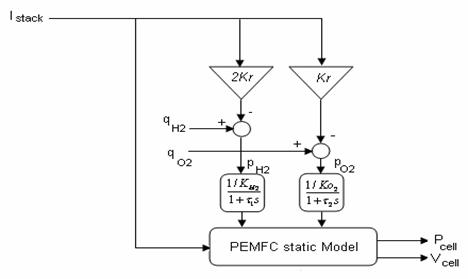
Figure 3. PEMFC dynamic model
The model parameters are as follows:
qH2: input molar flow of hydrogen [kmol/s];
qO2: input molar flow of oxygen [kmol/s];
PH2: hydrogen partial pressure [atm];
Po2: oxygen partial pressure [atm];
K H2 : hydrogen valve molar constant [kmol/(atm s)];
K O2 : oxygen valve molar constant [kmol/(atm s)];
N0 : number of series fuel cells in the stack;
Istack: stack current [A];
Kr : constant
=![]() Kmol/ (s.A)
Kmol/ (s.A)
F : Farady constant 9684600 C/Kmol
Reformer Model
In [7] and [8] the authors introduced a simple model of a reformer that generates hydrogen through reforming methane. The model is a second-order transfer function. The mathematical form of the model can be written as follows:
 (11)
(11)
Were CV: conversion factor [kmol of hydogen per kmol of methane];
qmethane methane flow rate [kmol/s];
τ 1τ2: reformer time constants [s]
DC/AC inverter Model
In this paper, only a simple model of a DC/AC inverter is considered for the following reasons: the dynamic time constant of inverters is of the order of microseconds or at the most milliseconds. The time constants for the reformer and stack are of the order of seconds model of the inverter is given in [9], where output voltage and output power are controlled using the inverter modulation index and the phase angle of the AC voltage. Considering the fuel cell as a source, the inverter and load connection is shown in Fig. 5. The output voltage and the output power as a function of the modulation index and the phase angle can be written as
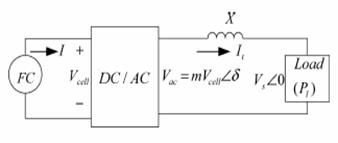
Figure 5. Fuel cell, Inverter and load connection diagram [9].
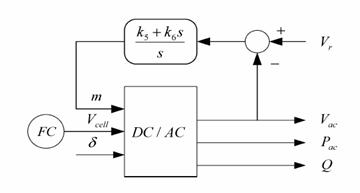
Figure 6. The DC/AC inverter model [9].
![]() (12)
(12)
![]() (13)
(13)
 (14)
(14)
![]() (15)
(15)
![]() (16)
(16)
Where the model parameter are as follows:
Vac AC output voltage of the inverter [V];
m: inverter modulation index;
δ :phase angle of the AC voltage [rad];
Pac AC output power from the inverter [W];
Qac: reactive output power from the inverter [VAR];
Vs :load terminal voltage [V];
X: reactance of the line connecting the fuel cell to the load
IL :load current [A];
θ :load phase angle [rad];
P :load power [W].
Istack :stack current [A].
PI controllers are used to control the modulation index. The transfer function of the modulation index can be expressed as
![]() (17)
(17)
Where
K5,and K6: are the PI gain, and Vr is the reference voltage signal. The block diagram of the inverter with the PI controllers is illustrated in Fig. 6
Assuming a lossless inverter, we get
![]() (18)
(18)
According to electrochemical relationships, a relationship between the stack current and the molar flow of hydrogen can be written as
![]() (19)
(19)
Were U is a utilization factor
From (13), (18 ) and (19)
 (20)
(20)
Assuming a small phase angle
![]() (21)
(21)
The equation (21) describes the relationship between output voltage phase angle and hydrogen flow . Equations (13) and (21) indicate that the active power as a function of the voltage phase angle can be controlled by controlling the amount of hydrogen flow.
Fuzzy logic controller
The active power flow from the PEMFC to the load is controlled thought controlling the flow hydrogen. The proposed fuzzy logic controller controls the active power by controlling the hydrogen flow.
The fuzzy controller consists of five different steps (fig 7) [10], [11]
· definition of input-output variables of controller
· design of fuzzy control rule
· fuzzification
· inference
· defuzzification
The fuzzy controller inputs are the error e(k), and change of error ce(k). The output of the controller is the duty ratio of hydrogen flow uH2(k). The error, change of error, and the output of the controller are given as follows:
![]() (22)
(22)
Were ![]() is the flow hydrogen from the current
feedback signal were is proportional to the terminal load fig (6),
is the flow hydrogen from the current
feedback signal were is proportional to the terminal load fig (6), ![]() is the
methane reference signal and
is the
methane reference signal and ![]() is the hydrogen flow feedback signal.
is the hydrogen flow feedback signal.
![]() (23)
(23)
![]() (24)
(24)
Were ![]() is the
inferred change of duty ratio by fuzzy controller and
is the
inferred change of duty ratio by fuzzy controller and ![]() is the gain factor of
the controller [6], [7]
is the gain factor of
the controller [6], [7]
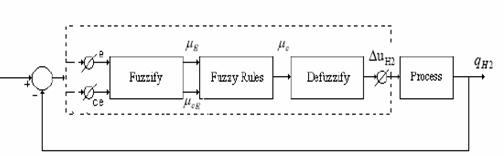
Figure 7. The block diagram of a fuzzy logic controller
Fig 8 shows the basic fuzzy partition of membership function for error, change of error, and change of control action. And fuzzy variables are expressed by linguistic variables such as” positive big (PB)” ,positive medium(PM)”,”zero(ZO)”,”negative medium(NM)” ,”negative big(NB)”. Table 2 shows the fuzzy model based on fuzzy rules[7].
Example fuzzy rules are:
·
“ If e(k) is PM and ce(k) ZO then ![]() is PM
is PM
·
“ If e(k) is NB and ce(k) NM then ![]() is NB
is NB
The inference method used is basic and simple; it is developed from
the minimum operation function rule as a fuzzy implementing function. The
membership function of e, ce and ![]() are given by
are given by ![]() ,
, ![]() ,
,![]()
![]() .The
commonly use Min-Max method is given as:
.The
commonly use Min-Max method is given as:
![]() i=1…n (25)
i=1…n (25)
![]() i=1…n (26)
i=1…n (26)
The centroid defuzzification method determines the output value from center of gravity of the output membership function and is given by the expression.
 (27)
(27)
Based on table 2 and fig 8, the 3-dimensinal representation of
control input (![]() ) for fuzzy variables (e, ce) is shown
in fig 9.
) for fuzzy variables (e, ce) is shown
in fig 9.
Table 1: Linguistic control rule
|
CHANGE OF ERROR |
||||||
|
E R R O R |
U |
NB |
NM |
ZO |
PM |
PB |
|
NB |
NB |
NB |
NM |
NM |
ZO |
|
|
NM |
NB |
NM |
NM |
ZO |
PM |
|
|
ZO |
NM |
NM |
ZO |
PM |
PM |
|
|
PM |
NM |
ZO |
PM |
PM |
PB |
|
|
PB |
ZO |
PM |
PM |
PB |
PB |
|
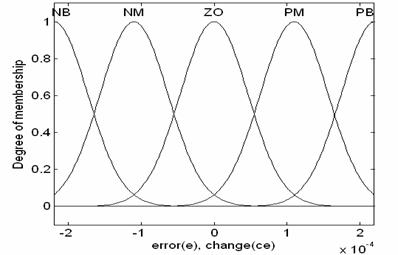
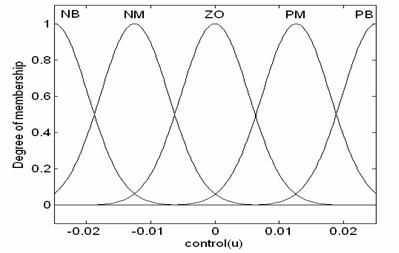
Figure 8. Membership fonction for error (e), change (ce) and control (u)
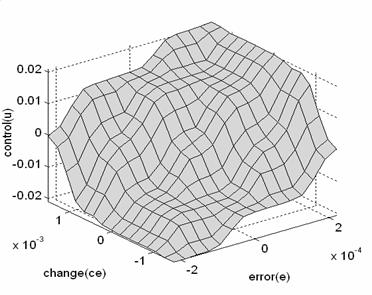
Figure 9. The 3 dimensional representation of control input (![]() ) for fuzzy
variables (e,ce)
) for fuzzy
variables (e,ce)
Simulation Results
The model parameter are given in Table 3.The model of Fuel cell system for residential power generation and fuzzy logic block diagram shown in fig (10). It is tested with step change in the load as shown in fig (11) These abrupt changes in the active and reactive power are for testing the dynamic response of the system and do not necessarily represent change in residential load.
In a practical system, the response time of the reformer can be longer than tens second [11], [12]. Therefore the reformer controller parameters have significant effect on the active power control. In this simulation the fuzzy logic controller was able to modify hydrogen flow for controlling active power to the load change fig 12. The fuzzy logic controller is characterized by faster time response compared to the PID controllers used in fig 13.
Table 3 System parameters [8], [9].
|
Parameters |
Values |
|
Facteur de conversion CV |
2 |
|
farady,s Constant, F |
9684600 C/Kmol |
|
Universal gas Constant R |
8314.47 j/Kmol.K |
|
Number of cells N0 |
333 |
|
Hydrogen valve constant KH2 |
4.22*10-5 Kmol/(s.A) |
|
Oxygen valve constant KO2 |
2.11*10-5 Kmol/ (s.atm) |
|
Hydrogen time constant, |
3.37 (s) |
|
Oxygen time constant, |
6.74 (s) |
|
Utilization factor,U |
0.8 |
|
PI gain constants K5,K6 |
10 |
|
Hydrogen –Oxygen flow ratio rH-O |
1.168 |
|
Methane reference signal, qref |
0.000015 Kmol/ s |
|
Reformer time constants τ1 , τ2 |
2, 2 |
|
Line reactance, X |
0.05Ω |
|
Voltage reference signal Vr |
240 V |
|
Kr constant = |
0.996*10-6 Kmol/ (s.A) |
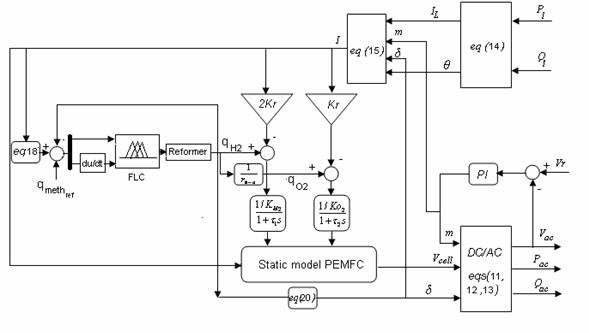
Figure10. PEM fuel cell system and fuzzy logic block diagram
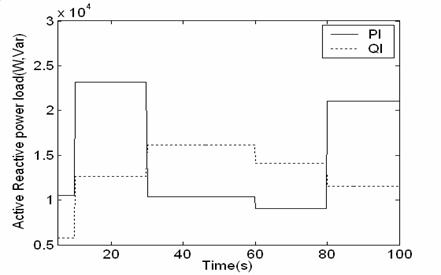
Figure11. Load step changes
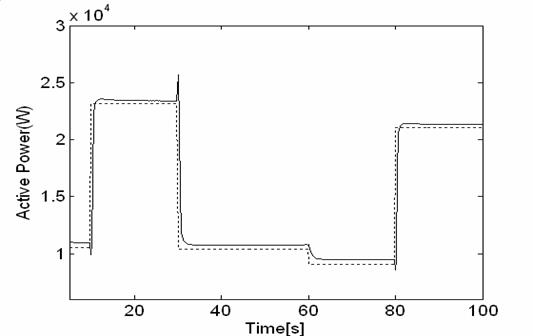
Figure12. Active output power change (with fuzzy logic controller)
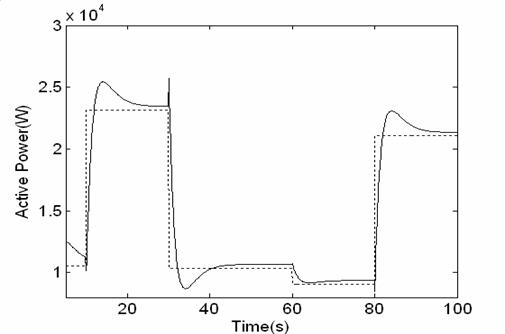
Figure13. Active output power change (with PID controller)
The change of the current is illustrated in fig 14. This change is very sensitive to variation of the active power load.
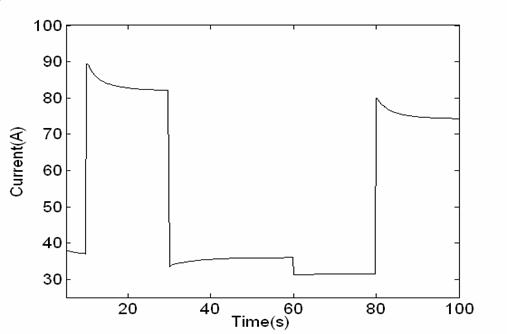
Figure14. current change
Figure 15 show the change of hydrogen flow. This change is similar to the change of active power
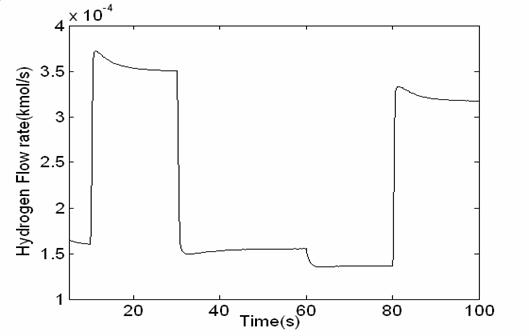
Figure15. Hydrogen flow rate change
The reactive power Qac follows immediately the change of the reactive power load. Because the reactive power is controlled directly from DC/AC inverter and the response of DC/AC inverter is not considerable fig 16
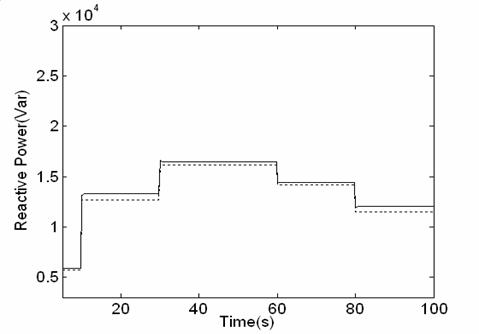
Figure16. Reactive output power change
The change of the output voltage phase angle and modulation index are illustrated in figures 15 and 16
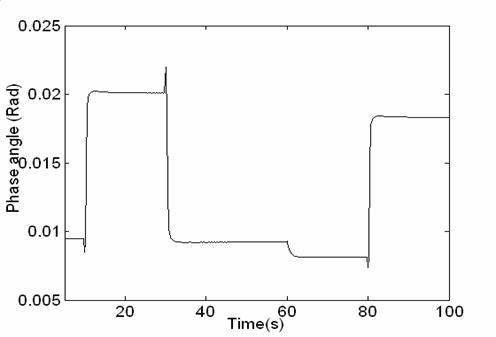
Figure17. Output voltage phase angle change
We notice that, the reactive power value is superior to the reactive power. This is due to inductive effect losses of the line (x).
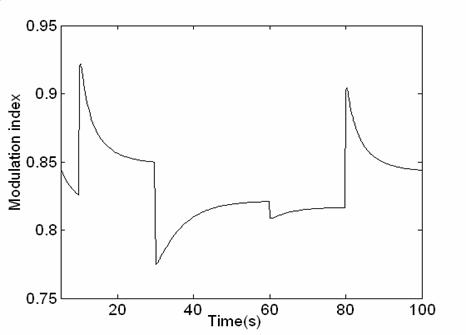
Figure18. Modulation index change
Conclusion
In this paper the fuel cell system model for residential generation is proposed. The proposed model includes a dynamic fuel cell model, a gas reformer model, DC/AC inverter model, and fuzzy logic controller unit block. Then the developed model is tested using computer-simulated step change in the load active and reactive power demands. The simulation results indicate that converter and fuel quantities have to be controlled simultaneously to control the active and reactive power. It also indicate that the fuzzy logic controller is very effective to control hydrogen flow for active power load variation.
References
1. J. C. Amphlett, R. F. Mann, B. A. Peppley, P. R. Roberge, and A. Rodrigues: A model predicting transient responses of proton exchange membrane fuel cells. J. Power Sources, vol. 61, pp. 183–188, A. B., Name C. D., Title of the article, Journal, 1996.
2. J. J. Baschuck and X. Li: Modelling of polymer electrolyte membrane fuel cells with variable degrees of water flooding. J. Power Sources, vol. 86, pp. 181–196, 2000.
3. P. Famouri and R. Gemmen: PEM fuel cell electric circuit model. presented at the Power Electronics for Fuel Cells Workshop, Nat. Fuel Cells Res. Center, Univ. California, Irvine, CA, Aug. 8–9, 2002.
4. C. J. Hatziadoniu et al.: A simplified dynamic model of grid-connected fuel-cell generators. IEEE Trans. Power Delivery, vol. 17, pp. 467–473, Apr. 2002.
5. Jeferson M. Corrêa, Student Member, IEEE, Felix A. Farret, Luciane N. Canha, and Marcelo G. Simões : An Electrochemical-Based Fuel-Cell Model Suitable for Electrical Engineering Automation Approach. IEEE Transactios on Industrial Electronics, vol .51, No 5, Octobr 2004.
6. Jeferson M. Corrêa, Student Member, IEEE, Felix A. Farret, Jonas R. Gomes, and, Marcelo Godoy Simões, Senior Member, IEEE: Simulation of Fuel-Cell Stacks Using a Computer- Controlled Power Rectifier With the Purposes of Actual High- Power Injection Applications. IEEE Transactios on Industrial ,Applications, vol 39, N04, July/August 2003.
7. M. Y. El-Sharkh, Member, IEEE, A. Rahman, Life Senior Member, IEEE, M. S. Alam, Senior Member, IEEE, A. A. Sakla, Senior Member, IEEE, P. C. Byrne, Member, IEEE, and T. Thomas, Member, IEEE: Analysis of Active and Reactive Power Control of a Stand-Alone PEM Fuel Cell Power Plant. IEEE Transactios on Power Ssystems , vol .19, N04, November 2004.
8. M. Y. El-Sharkh and M.S Alam: A dynamic model for a stand-alone PEM fuel cell power plant for residential application. J. Power Sources, , submitted for publication, June 2004.
9. M. Y. El-Sharkh , A. Rahman and M..S Alam: Neural networks-based control of active and reactive power of a Stand-Alone PEM Fuel Cell Power Plant. J. Power Sources, 19 June 2004, Available online.
10. Abhishek Sakhare, Asad Davari and Ali Feliachi: Fuzzy logic control of fuel cell for stand-alone and grid connection. Journal of Power Sources, Volume 135, Issues 1-2, 3 Pages 165-176, September 2004.
11. Kisacikoglu, M.C.; Uzunoglu, M.; Alam, M.S: Fuzzy Logic Control of a Fuel Cell/Battery/Ultra-capacitor Hybrid Vehicular Power System. Vehicle Power and Propulsion Conference, VPPC 2007. IEEE Volume , Issue , 9-12 Sept. 2007 Page(s):591 – 596, 2007.