Performance Analysis of a Voltage Source Converter (VSC) based HVDC Transmission System under Faulted Conditions
Khatir Mohamed, Zidi Sid Ahmed, Hadjeri Samir, Fellah Mohammed Karim,
Amiri Rabie
Electrical Engineering Department, ICEPS Laboratory, Djillali Liabes University,
Sidi Bel Abbes, 22000, Algeria
E-mail(s): med_khatir@yahoo.fr , sbzidi@yahoo.fr
Abstract
Voltage Source Converter (VSC) based HVDC transmission technology has been selected as the basis for several recent projects due to its controllability, compact modular design, ease of system interface, and low environmental impact. This paper investigates the dynamic performance of a 200MW, ±100kV VSC-HVDC transmission system under some faulted conditions using MATLAB/Simulink. Simulation results confirm the satisfactory performance of the proposed system under active and reactive power variations and fault conditions.
Keywords
HVDC, Voltage source converter (VSC), IGBT, SPWM, Control design.
Introduction
With the development of power electronic technology and the relatively high switching frequency of Pulse Width Modulation (PWM), HVDC transmission system based on Voltage Source Converters (VSCs) has taken on some excellent advantages. The new VSC-HVDC system known as “HVDC Light” or “HVDC Plus” [1,2] by leading vendors, has been applied in several special occasions such as the connection of off-shore wind farms or oil drilling platforms into the mainland electrical network and for underground transmission or distribution systems within congested cities. The differences in structure between the two types of converters (Conventional HVDC and VSC-HVDC) contribute to the differences in their performance. Generally, the new transmission technology has the following advantages compared with conventional, thyristor based HVDC [3-5]:
- Possibility to control the reactive power (consumed or generated by the converter) independently of the active power (to or from the converter).
- No risk of commutation failures in the converter.
- Ability to connect to weak AC networks, or even dead networks.
- Faster response due to increased switching frequency (PWM).
- Minimal environmental impact.
However, VSC transmission does have some disadvantages, which include potentially high power losses and high capital costs when compared with conventional HVDC, but the technology continues to evolve.
This paper presents the elements of VSC-HVDC which uses twelve pulse three level converter topology and its control design. The paper wills first give a brief description about the VSC based HVDC transmission system and its terminal control functions. Following that typical operating contingency scenarios are simulated in order to evaluate transient performance. The simulation results confirm that the control strategy has fast response and strong stability.
Fundamentals of VSC transmission
The fundamentals of VSC transmission operation may be explained by considering each terminal as a voltage source connected to the AC transmission network via a three-phase reactor. The two terminals are interconnected by a DC link, as schematically shown in Fig. 1.
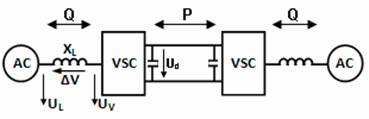
Fig 1. Basic VSC transmission
Fig. 2 shows a phasor diagram for the VSC converter connected to an AC network via a transformer inductance. The fundamental voltage on the valve side of the converter transformer, i.e. UV(1), is proportional to the DC voltage as been expressed in Eq(1):
|
UV(1) = kuUd |
(1) |
The
quantity ![]() can
be controlled by applying additional number of commutation per cycle, i.e.
applying pulse with modulation (PWM). Using the definition of the apparent
power and neglecting the resistance of the transformer results in the following
equations for the active and reactive power:
can
be controlled by applying additional number of commutation per cycle, i.e.
applying pulse with modulation (PWM). Using the definition of the apparent
power and neglecting the resistance of the transformer results in the following
equations for the active and reactive power:
|
|
(2) |
|
|
(3) |
The
active and reactive power will in the following be defined as positive if the
powers flow from the AC network to the converter. The phase displacement angle ![]() will then be positive
if the converter output voltage lags behind the AC voltage in phase.
will then be positive
if the converter output voltage lags behind the AC voltage in phase.
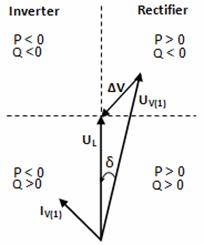
Fig 2. Phasor diagram of VSC and direction of power flows
Equation (2) gives that the active power is proportional to the DC current and the DC voltage. Furthermore it is mainly determined by the phase-displacement angle δ. A positive phase-shift results in that the active power flows from the AC network to the converter. However the reactive power is mainly determined by the difference between the magnitudes of the AC bus voltage and the converter output voltage according to the Eq(3). The reactive power is fed from the voltage with higher magnitude towards the voltage with the lower magnitude. Theses features permit the independent control of the reactive and active power which is a major advantage for the VSC. P-Q diagram is a circle according to Eq(4) with the centre not located at origin as it does for the line commutated converters as shown in Fig. 3.
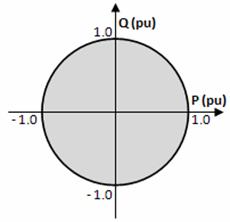
Fig 3. P-Q characteristics of a VSC-HVDC system
|
|
(4) |

If the output voltage of the converter UV (1) is reduced, e.i by using PWM, supply of any active and reactive power within the circle is possible.
System description
A 200 MW (± 100 kV) forced-commutated voltage-sourced converter (VSC) interconnection is used to transmit DC power from a 230 kV, 2000 MVA, 50 Hz system to another identical AC system. The AC systems (1 and 2) are modeled by damped L-R equivalents with an angle of 80 degrees at fundamental frequency and at the third harmonic. The rectifier and the inverter are three-level Neutral Point Clamped (NPC) VSC converters using close IGBT/Diodes. The rectifier and the inverter are interconnected through a 100 km cable (i.e. 2 pi sections) and two 8 mH smoothing reactors. The sinusoidal pulse width modulation (SPWM) switching uses a single-phase triangular carrier wave with a frequency of 27 time’s fundamental frequency (1350 Hz). A converter transformer (Wye grounded /Delta) is used to permit the optimal voltage transformation. The present winding arrangement blocks tripplen harmonics produced by the converter. The 0.15 pu phase reactor with the 0.15 pu transformer leakage reactance permits the VSC output voltage to shift in phase and amplitude with respect to the AC system Point of Common Coupling (PCC) and allows control of converter active and reactive power output. The tap position is rather at a fixed position determined by a multiplication factor applied to the primary nominal voltage of the converter transformers. The multiplication factors are chosen to have a modulation index around 0.85 (transformer ratios of 0.915 on the rectifier side and 1.015 on the inverter side). To meet AC system harmonic specifications, AC filters form an essential part of the scheme. They can be connected as shunt elements on the AC system side or the converter side of the converter transformer. Since there are only high frequency harmonics, shunt filtering is therefore relatively small compared to the converter rating. The 40 Mvar shunt AC filters are 27th and 54th high-pass tuned around the two dominating harmonics.
VSC-HVDC Control strategy
Fig. 4 shows an overview diagram of the VSC control system and its interface with the main circuit [6]. The converter 1 and converter 2 controller designs are identical. The two controllers are independent with no communication between them. Each converter has two degrees of freedom. In our case, these are used to control:
· P and Q in station 1 (rectifier)
· Ud and Q in station 2 (inverter).
Phase locked loop
The phase locked loop (PLL) shown in fig.4 is used to synchronise the converter control with the line voltage and also to compute the transformation angle used in the d-q transformation.
The PLL block measures the system frequency and provides the phase synchronous angle Ө for the d-q transformations block. In steady state, sin(Ө) is in phase with the fundamental (positive sequence) of α component and phase A of the point of common coupling voltage (Uabc).
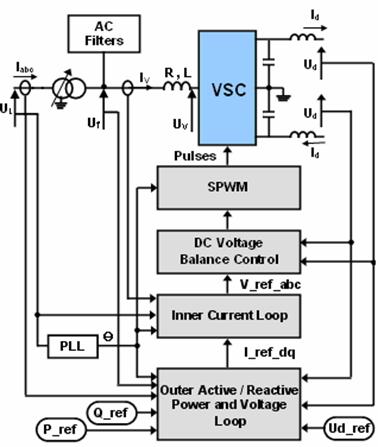
Fig 4. Overview diagram of the VSC control system
Outer active and reactive power and voltage loop
The active power or the DC voltage is controlled by the control of δ and the reactive power is controlled by the control of the modulation index (m). The instantaneous real and imaginary power of the inverter on the valve side can be expressed in terms of the dq component of the current and the voltage on the valve side as follows:
|
|
(5) |
|
|
(6) |
If the reference of the dq-frame is selected such that the quadrature component of the voltage is being very small and negligible (uLq ≈ 0) then the Eq(5) and Eq(6) indicate that the active and the reactive power are proportional to the d and q component of the current respectively. Accordingly, it is possible to control the active power (or the DC voltage or the DC current) and the reactive power (or the AC bus voltage) by control of the current components ivd and ivq respectively. The active and reactive power and voltage loop contains the outer loop regulators that calculate the reference value of the converter current vector (I*dq) which is the input to the inner current loop.
Inner Current Loop
For each of the phases we can write:
|
|
(7) |
During
unbalanced operation [7], the expression for the voltage drop over the reactor
(![]() ) holds
for positive as well as for negative-sequence voltages and currents. The
voltages drops are described by the differential equation:
) holds
for positive as well as for negative-sequence voltages and currents. The
voltages drops are described by the differential equation:
|
|
(8) |

where X =(p) for positive sequence and (n) for negative sequence. Equation (8) can be transformed to the α β-frame. This gives for the voltages and currents:
|
|
(9) |

Eq(9) can be further transferred into the rotating dq-frame:
|
|
(10) |

and
|
|
(11) |

The positive and negative sequence voltages of the VSC side are obtained from (10) and (11):
|
|
(12) |
|
|
(13) |
and
|
|
(14) |
|
|
(15) |
The mean voltages over the sample period k to k+1 are derived by integrating (12), (13), (14) and (15) from kTs to (k+1)Ts and dividing by Ts (where Ts is the sampling time).
|
|
(16) |
|
|
(17) |
and
|
|
(18) |
|
|
(19) |
By assuming linear current and constant network voltage (the network voltage varies very little during a switching time period) during one sample period Ts we obtain from (16) through (19):
|
|
(20) |
|
|
(21) |
|
|
(22) |
|
|
(23) |
The control is based on (20), (21), (22) and (23), where the voltages and currents at time (k+1) are thus equal to the reference values at time step (k).
DC Voltage Balance Control
The difference between the DC side voltages (positive and negative) are controlled to keep the DC side of the three level bridge balanced (i.e., equal pole voltages) in steady-state. Small deviations between the pole voltages may occur at changes of active/reactive converter current or due to nonlinearity on lack of precision in the execution of the pulse width modulated bridge voltage. Furthermore, deviations between the pole voltages may be due to inherent unbalance in the circuit components impedance.
Simulations Results
The dynamic performance of the transmission system is verified by simulating the:
1. Steps on the regulators references,
2. Recovery from severe perturbations in the AC system.
Step Responses
In order to test the dynamic responses of the VSC-HVDC regulators, four test cases have been studied. The simulation includes power reversion from – 0.5pu to + 0.5pu, of station 1 at t = 1.3s, then active power step changes from 0.5pu to 1.0pu at t = 2.5s (Case 1 and 2). At t = 2.0s, the reactive power step change from 0 pu to – 0.3pu of station 1, then set to +0.3 pu at t = 2.7s (Case 3). At station 2, the DC voltage step change from 1 pu to 0.095 pu at t = 3 s (case 4, with the constant reactive power of – 0,1pu). The results are shown in fig.5. After steady state has been reached, the converter 1 active power reference value is changed from from – 0.5 pu to + 0.5 pu and then set to 1.0 pu at t = 2.5s. As can be seen, the active power can track the reference of the active power. The transferred active powers at both sides change the direction which causes transients on the DC voltage then returns to the reference value due to the DC voltage controller. The AC voltages at the filter bus (Uf1 and Uf2), can be kept constant except for some transients that occur when both the step changes are applied. The active power flow is adjusted to the new setting within 30 ms. At t = 2.0s the reactive power step change is applied, then another step at t = 2.7s. Theses two steps change cause transients on the DC voltage, but, as expected, the step change of the active power causes a much higher transient than that with the change in reactive power. At t = 2.5s the active power change to 1pu, and later another step is also applied on the reference DC voltage of the station 2 at t =3.0s. The reactive power and the DC voltage can track the references of the reactive power and the DC voltage. The active and reactive power responses are decoupled by the control design.
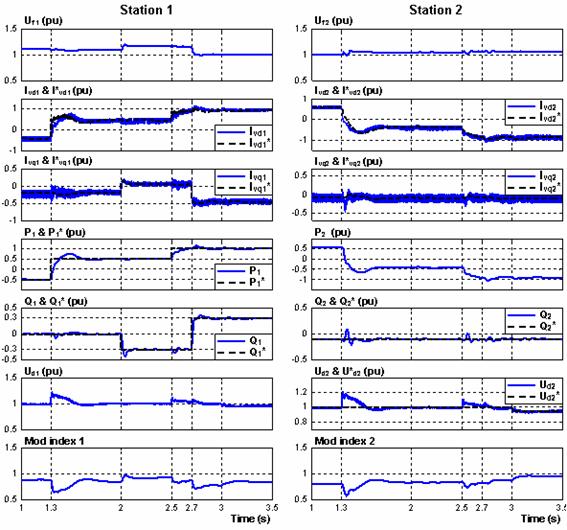
Fig 5. Steps on the regulators references
AC Side Perturbations
A single phase to ground fault was first applied at t = 1.3s during 0.10s (5 cycles) at station 1 in order to investigate the behaviour of VSC-HVDC during unbalanced faults. A second perturbation follows. A three-phase to ground fault is applied at station 2 at t = 2.0s and is cleared at 5 cycles after the fault, i.e., at t = 2.1s. Fig.6 presents the simulations results.
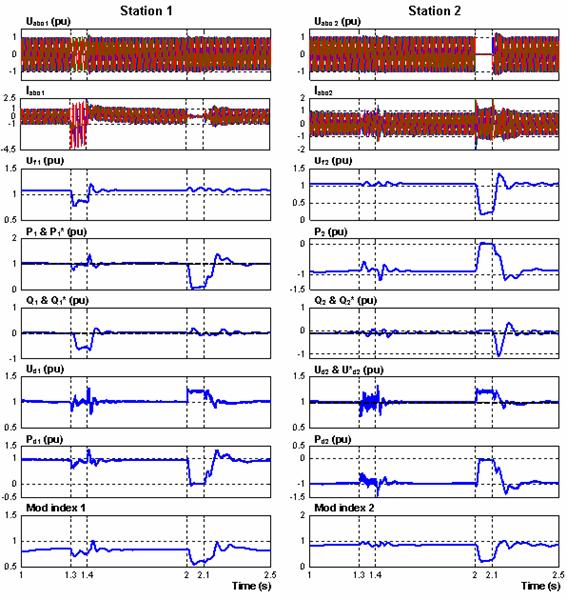
Fig 6. AC side perturbations
From the simulation, it can be noted that before a single phase to ground fault at station 1, the active power flow is 1.0 pu, transmitted from converter 1 to converter 2, and is kept constant during the fault. The DC voltage drops and it contains an oscillation during the fault. Consequently the transferred DC power contains also the oscillation. During the station 1 side fault the transmitted power can be kept constant except a small oscillation during the fault. All oscillations in voltages and currents at both systems, means that the phase voltages and currents at both systems are unbalanced.
During the severe three-phase fault at station 2 at t = 2.0 s, the AC voltage at station 2 side is decreased to 0.1 pu during the fault and recovers fast and successfully to 1.0 pu voltage after clearing the fault. The transmitted power flow is reduced to very low value during the fault and recovers to 1.0 pu after the fault. The DC voltage, which can be controlled to 1.0 pu during the fault, has some oscillations at the beginning of the fault and at clearing the fault, and its maximum transient value is about 1.2 pu. On the other hand, the phase currents at station 1 side decrease to low values to reduce the power flow.
Conclusions
In this paper, we have presented the steady-state and dynamic performances of VSC based HVDC transmission system during step changes of the active and reactive powers, balanced and unbalanced faults. In all cases the proposed control strategy has been shown to provide fast and satisfactory dynamic responses of the proposed system. From the simulation, it can be obtained that the VSC-HVDC can fulfil fast and bi-directional power transfers. It can be obtained also that during a single-phase fault the transmitted power can be kept constant except a small oscillation during the fault. However, during a three-phase fault; the decreased voltage at the converter terminals strongly reduces the power flow by the DC link. When the fault is cleared, normal operation is recovered fast.
Appendix
|
Station 1(Rectifier side) |
230kV(80°), 2000 MVA, SCR = 10, L1 = 31.02 mH, R = 13.79Ω, L2 = 62.23 mH. |
|
Station 2 (Inverter side) |
230kV(80°), 1000 MVA, SCR = 5, L1 = 62.04 mH , R = 27.58 Ω, L2 = 124.46 mH |
|
Transformer |
Yg/Δ, 230kV/100kV, 200 MVA, 15% |
|
Main DC capacitor |
70 µF |
|
DC Cables |
100km×2 (R=0.0139 Ω /km, L = 0.159 mH/km, C = 23.1 µF/km) |
|
Switching frequency |
1350 Hz |
![]()
Nomenclature
UL = the sinusoidal AC voltage in the AC network
Uf = AC voltage in the AC network at the filter-bus
UV (1) = the fundamental line to line voltage (valve side)
XL = the leakage reactance of the transformer
δ= phase shift between UL and UV (1)
IV = source current
L, R = phase reactor inductance and resistance
C = DC side capacitance
ω= source voltage angular frequency
m = modulation index
P, Q = AC active, reactive power inputs
Ud, Id, Pd = DC side voltage, current, power
α, β = stationary α -β axis
d, q = synchronous d -q axis
p, n = positive, negative components
* = reference value for controller
References
1. Weimers L., HVDC Light: A New Technology for a Better Environment, IEEE Power Engineering Review, 1998, 18(8), p. 9-20.
2. Schettler F., Huang H., Christl N., HVDC transmission systems using voltage sourced converters design and applications, IEEE Power Engineering Society Summer Meeting, 2000, 2, p. 715-720.
3. Asplund G., Application of HVDC Light to power system enhancement, IEEE Power Engineering Society Winter Meeting., 2000, 4, p. 2498-2503.
4. Weimers L., New markets need new technology, International Conference on Power System Technology, PowerCon, 2000, 2, p. 873-877.
5. Smith D., Cross Sound HVDC Link Extends IGBT Power, Modern Power Systems – Transmission & Distribution, pp. 31-36, October 2000.
6. Lindberg A., Larsson T., PWM and Control of Three Level Voltage Source Converters in an Hvdc Back-to-back Station, Sixth International Conference on AC and DC Power Transmission, 1996, pp. 297-302, 29 Apr-3 May.
7. Lie Xu, Andersen B. R.; Cartwright P., Control of VSC transmission systems under unbalanced network conditions, Transmission and Distribution Conference and Exposition, 7-12 Sept, 2003 IEEE PES, 2003, 2, pp. 626-632.