Optimal Power Flow Based Global Voltage Stability Analysis Using Network Equivalencing Technique: A Case Study of Widespread Sub-Grid
Palukuru NAGENDRA*, Sunita Halder nee DEY and Subrata PAUL
Department of Electrical Engg.,
E-mail: indrapn@gmail.com; sunitaju@yahoo.com; spaul@ee.jdvu.ac.in
(* Corresponding author)
Abstract
The objective this paper is to develop a methodology to assess the voltage stability considering optimal operating criteria using the concept of equivalencing the multi-bus power system to a two-bus network model and by studying the necessary parameters of the equivalent system. There by, a generalized global voltage stability indicator being developed, it has been applied to a typical longitudinal power supply (LPS) system and a robust practical 203-bus Indian Eastern Grid system. Simulation results have proved that this new network equivalent method is promising to assess voltage stability of any power system at any operating point in global scenario. In the equivalent network the generators are modelled more accurately considering economic criteria.
Keywords
Equivalent Two-Bus Network; Global Voltage Stability; Optimal Power Flow; Weak Bus.
Introduction
With the ever-increasing electrical energy demand of power system without sufficient transmission and /or generation enhancement, the voltage stability problem has become a major concern in planning and operation. Many recent large-scale power system breakdowns have been the consequence of instabilities characterized by sudden voltage collapse phenomena [1, 2]. Voltage instability is a local phenomenon and it occurs at a bus within an area with high loads and low voltage profile. The remote buses usually have very little influence to improve the voltage stability of the affected bus. However, the voltage problem of the affected bus may cause a series of line outages and the ultimate result is system blackout. Therefore, voltage stability analysis is important in order to identify the critical buses in a power system i.e., buses which are closed to their voltage stability limits and thus enable certain measures to be taken by the operators in order to avoid any incidence of voltage collapse. Literature survey [3-6] reveals the common techniques for voltage stability assessment are based on the load flow solution feasibility, optimal power flow, bifurcation technique, singularity of Jacobian etc. Different voltage stability indicators have also been established covering both static and dynamic aspects of the problem [7].
The power system equivalents, on the other hand, are of importance [8-10] for the study of static characteristics of a large system when either the computer facilities for direct solution or the available solution time is restricted. Also, the use of equivalent representation of the complex system is required frequently to simplify the lengthy calculations and analysis system stability easily on the equivalence. Subsequently, they became useful in loosely defined planning scenarios and energy management systems network analysis. This paper describes a unique method of equivalencing a multi-bus power network to an equivalent two-bus system developed from optimal power flow method and thereby voltage stable states of the entire system in terms of equivalent domain [11-13], following the load changes in ‘weak’ load buses investigated for a typical power system networks.
Optimal Power Flow
The main purpose of an OPF program is to determine the optimal operation
state of the power system by optimizing a particular objective while satisfying
certain specified physical and operational constraints. In this paper,
The cost function (![]() ) of a N-bus power system having NG number of
fossil fuel units is given by [14]:
) of a N-bus power system having NG number of
fossil fuel units is given by [14]:
 unit of
cost/hr
(1)
unit of
cost/hr
(1)
where αi,
βi, γi are the cost coefficients of ith
generator; ![]() , the real power generation at ith
generator bus; NG, the total number of generators;
, the real power generation at ith
generator bus; NG, the total number of generators; ![]() ,
the cost of generation at ith generator; and
,
the cost of generation at ith generator; and ![]() ,
the total cost of generation in the system.
,
the total cost of generation in the system.
The aim of optimal power flow is to optimize the cost function subjected to active power, reactive power and security related constraints. The Lagrangian function for optimal power system is given by

 (2)
(2)
where Pi
and Qi are the active and reactive power injections at ith
bus respectively; ![]() is the reactive power generation at ith
bus;
is the reactive power generation at ith
bus; ![]() and
and ![]() are
Lagrangian multipliers for active power and reactive power balance at the ith
bus respectively. From (2) the changes in control variables are available as
are
Lagrangian multipliers for active power and reactive power balance at the ith
bus respectively. From (2) the changes in control variables are available as
 (3)
(3)
or [H] [Change in control variables] = [J] where [H] and [J] are Hessian and Jacobian matrices, respectively.
Starting from initial data of an interconnected power system optimal power flow solution may be achieved by solving (3) using iterative process and thereby both power generations and voltages are calculated simultaneously considering the economics of operation with all system constraints taken into account. As the Hessian matrix, [H] becomes singular, there will be a large change in control parameters of the system and therefore the critical point of optimal power flow solution, beyond which there will be no possible generation, can be identified. This state represents the voltage stability limit of the system.
The total complex power loss of the entire multi-bus power network being the algebraic sum of the all line flows in the system, the power balance equation for multi-bus power system is given by
![]() (4)
(4)
Equivalent Two-Bus Network and Formulation of GVSI
Development of Equivalent Two-Bus Network
Let us assume a two-bus equivalent network where sending end bus is assumed as a generator bus and receiving end as a load bus connected by a line impedance, representing the equivalent of the entire multi-bus network as shown in Fig.1.

Figure 1. Equivalent two-bus power network
The behaviour of the proposed two-bus equivalent network will be same as that of multi-bus network [15-16]. Therefore, the power balance equation for the two-bus equivalent network can be written as:
![]() (5)
(5)
The complex power loss for this equivalent system is given by
 (6)
(6)
where Pg, Qg are real and reactive power generations respectively; Sg, Sload are the total complex source and load powers respectively; SL is total complex power loss; and Zeq is equivalent impedance of the two-bus network.
The sending end voltage, Vs being assumed to be at nominal value of 1.0 p.u., the Zeq can be obtained. Then, the receiving end voltage Vr can easily be calculated as follows:
 (7)
(7)
Thus the two-bus system developed above becomes the equivalent model of a multi-bus network at any particular network and load configuration.
Global Voltage Stability Analysis
Once the global two-bus power network equivalent to multi-bus power system is obtained then the global voltage stability indicator could be formulated in a straight forward manner from the parameters of global network as follows:
The voltage-current relation in terms of ABCD parameters for the series equivalent circuit of the transmission line, is given by
 (8)
(8)
where

Assuming ![]() ;
; ![]() and the
sending end voltage, Vs being constant (1Ð00 p.u.), the active and
reactive power at receiving end are given by
and the
sending end voltage, Vs being constant (1Ð00 p.u.), the active and
reactive power at receiving end are given by
![]()
![]()
The Jacobian matrix [15-17] of above power flow equation is given by

then, the determinant of jacobian matrix
![]()
At the critical point of voltage stability [17], ∆[J] = 0
![]() (9)
(9)
where Vcr, dcr is the critical values of receiving end voltage and power angle respectively at voltage stability limit.
Also, the critical power angle, ![]() ;
;
Again taking Vr as reference phasor, the fundamental power equation may be represented as,
![]() (10)
(10)
Taking the first derivative of (10) with respect to S (complex load bus power), simplification yields (at voltage stability limit),
 (11)
(11)
Taking into account the profile of voltage against S (Figure 2) voltage stability limit is attained obviously when dVr/dS = 0; voltage stability is maintained till the slope of dVr/dS is negative, (i.e. when Vr<Vs/2). Therefore, to secure global voltage stability, global voltage stability indicator can be defined as GVSI = dVr/dS. It indicates how far the present operating condition is from global system voltage collapse i.e., the global voltage security status of the present operating condition. Therefore, with Vs=1 p.u, voltage stability of the two-bus network is maintained when
 (12)
(12)

Figure 2. P – V curve
Computational Procedure
The necessary algorithm of the proposed methodology for equivalencing the multi-bus system to a two-bus system and computing voltage stable states is presented below:
1. Run the optimal power flow for base case and identify the weakest bus of the given multi-bus system and define power factor of load at weakest bus.
2. Increase the active load of the weakest bus in small step and modify reactive load keeping power factor constant.
3. Run the optimal power flow algorithm of the given multi-bus system. Go to step-8 if the OPF algorithm does not converge.
4. Calculate the total generation, load and transmission line loss of the system.
5. Find equivalent impedance (Zeq) for the equivalent two-bus model.
6. Calculate Vcr (i.e., voltage corresponds to voltage collapse point), Vglobal (i.e., receiving end voltage of the equivalent system) and global voltage stability indicator (dVr/dS).
7. Goto step-2.
8. Stop.
Results and Discussion
The developed concept has been applied to a longitudinal 6-bus test system and a robust practical West Bengal State Electricity Board (WBSEB) 203-bus (Indian Eastern grid) system, the single line diagrams of which are given in appendix. The LPS system has 3 generators, 2 transformers and 6 load buses which are interconnected by 8 transmission lines. The WBSEB 203-bus power system has 24 generators, 35 three-winding line transformers, 37 two-winding load transformers, 35 tertiary-winding transformers and 108 load buses which are connected by 267 transmission lines. A computer software programme has been developed in the MATLAB environment to perform the simulations on the systems considered. The reactive power sensitivity analysis reveals that bus numbers 4, 5 and 6 in LPS system and 172, 173, 171 in the practical WBSEB grid system are the critical buses consecutively.
For both the systems, the complex loading at the weakest bus is increased in steps up to a point at which OPF method is diverged indicating total voltage collapse of the system keeping the power factor constant at 0.85 lag. Two-bus equivalents being first developed, the profiles of global parameters have been obtained for dynamic changes in system load demands at any particular load bus separately for bus numbers 4, 5, 6 in 6-bus system and 172, 173, 171 in case of the practical system. The results are encouraging to assess the global voltage stability of the system and are provided with the graphs given below.
The voltage profiles of the individual load buses have been plotted for 6-bus and practical 203-bus systems in Figs. 3 and 4 respectively for system operating load variations at respective load buses. Observation of individual load bus voltage decline profile in Fig. 3 reveals that the bus voltage approaches instability much earlier for increase in system loading in bus 4 than the bus voltage in bus 5 or 6 for 6-bus system. Degree of stability is thus the lowest for bus 4 followed by those of bus numbers 5 and 6. Similarly Fig. 4 reveals that the bus voltage approaches instability much earlier for increase in system loading in bus 172 than the bus voltage in bus 173 or 171 for WBSEB grid system.
Figure 3. Profiles of voltage of the load bus under simulation for LPS system
Figure 4. Profiles of voltage of the load bus under simulation for WBSEB grid system
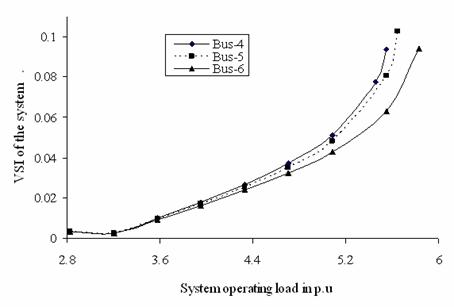
Figure 5. Profile of VSI criterion applied for equivalent system for change in complex power demand in load buses for LPS system
Figure 6. Profile of VSI criterion applied for equivalent system for change in complex power demand in load buses for WBSEB grid system
Figures 5 and 6 exhibit the profiles of the computed |dVr/dS| (global voltage stability indicator) for the equivalent system for complex power demand variation at the load buses of the original multi-bus network indicating loss of voltage stability much earlier in case of weakest buses than that of consecutive weak buses of the LPS and WBSEB grid system respectively. These profiles help to assess the vulnerability of the respective power system towards global voltage collapse and at the point of global voltage collapse, the slope of the |dVr/dS| is negative.
Figure 7 and 8 exhibit the variation in global receiving end voltage (Vg) for the equivalent two-bus system of the multi-bus network for system load variation at respective weak load buses of the original six bus and 203-bus power networks respectively. The global receiving end voltage is gradually decreasing with the enhancement of load indicating the system is approaching towards local voltage collapse at equivalent receiving end. The voltage stable and unstable portions of the graph in Fig. 7 being the upper and lower portion of the profiles respectively, the nose point represents the point of critical voltage stability for each of the individual simulation cases. It may again be observed that the bus number 4 is the most vulnerable to voltage collapse followed by bus numbers 5 and 6 in the simulated six bus network. Similar observations have been revealed for simulations in practical system. The unstable portion is not shown for WBSEB grid system to make the stable portion clearly visible.
Figure 7. Profile of global voltage for change in complex power demand in load buses for LPS system
Figure 8. Profile of global voltage for change in complex power demand in load buses for WBSEB grid system
Figure 9 and 10 exhibit the variation in determinant of Hessian matrix for variation of load at respective weakest load buses for the two test systems respectively. With increase in system load, the determinant of Hessian matrix approaches zero indicating the system’s susceptibility towards voltage collapse which perfectly matches with profiles of global VSI (Figure 5 and 6) and thus relate the original system and the proposed equivalent two-bus model in a better way.
Figure 9. Profile of Determinant of Hessian matrix of the LPS system with increase in load at weakest bus
Figure 10. Profile of Determinant of Hessian matrix of the WBSEB grid system with increase in load at weakest bus
Conclusions
A unique network equivalencing technique to diagnose the weakest bus and assess the voltage stability in a multi-bus power system network utilizing the operational parameters obtained from optimal power flow considering economical criteria has been developed. The operating variables for the developed two-bus equivalent network being termed as global voltage, global critical voltage etc., the OPF simulation for determination of these parameters helps to diagnose the weakest part of the multi-bus power system and is thus extremely helpful in assessment of voltage stability. The investigation on a LPS system and on the robust WBSEB 203-bus (Indian Eastern grid) system reveals that the proposed technique is promising to detect the weakest load bus as well as the global voltage stable states of the entire network following any disturbance in the load structure of the network.
Acknowledgements
The authors gratefully acknowledge the authorities of the
References
1. Bian J., Rastgoufard C.D., Power system voltage stability and security assessment, Int. J. Electr. Power Syst. Research, 1994, 30(3), p. 197-201.
2.
3. Ajjarapu V., Lee B., Bifurcation theory and its application to nonlinear dynamical phenomena in an electrical power system, IEEE Trans. Power Systems, 1992, 7(1), p. 424-431.
4. Salama M.M., Saied E.M., Abdel-Maskoud S.M., Steady state voltage assessment in power system, Int. J Energy conversion and Management, 1999, 40 (1), p. 59-69.
5. Venikov V.A., Sterov V.A., Idelchick V.I., Tarasov V.I., Estimation of electric power system steady state stability in load flow calculation, IEEE Trans. Power App. Syst., 1975, PAS-94 (3), p.1034-1041.
6. Vaahedi E., Tamby J., Mansour Y., Wenjuan Li., Sun D., Large scale voltage stability constrained optimal VAR planning and voltage stability applications using existing OPF/ optimal VAR planning tools, IEEE Trans. Power Systems, 1999, 14 (1) p. 65-74.
7. Morison G.K., Gao B., Kundur P., Voltage stability analysis using static and dynamic approaches, IEEE Trans. Power Systems, 1993, 8(3) p. 1159-1171.
8. Housos E.C., Irisarri G., Porter R.M., Sasson A.M., Steady state network equivalents for power system planning applications, IEEE Trans. Power App. Systems, 1980, PAS -99(6), p. 2113-2120.
9. Rahman T.K.A., Jasmon G.B., A new technique for voltage stability assessment in a power system and improve load flow algorithm for distribution network, IEEE 1995, Proc. of EMPD’95, 2, p. 714-719.
10. Kashem M.A., Ganapathy V., Jasmon G.B., Network reconfiguration for enhancement of voltage stability in distribution networks, IEE Proc-Gener, Transm, Distrib., 2000, 147(3), p. 171-175.
11. Verbic G., Gubina F., A new concept of voltage-collapse protection based on local phasors, IEEE Trans. Power Del., 2004, 19(2), p. 576-581.
12. Smon I., Verbic G., Gubina F., Local voltage-stability index using Tellegen’s theorem, IEEE Trans. Power Systems, 2006, 21(3), p. 1267-1275.
13. Corsi S., Taranto G. N., A real time voltage instability identification algorithm based on local phasor measurements, IEEE Trans. Power Systems, 2008, 23(3), p. 1271-1279.
14. Chakrabarti A., Sunita Halder, Power system analysis: operation and control, New Delhi, India, Prentice Hall of India (pvt) Ltd., 2nd edition, 2008.
15. Gubina F., Strmcnik B., A simple approach to voltage stability assessment in radial networks, IEEE Trans. Power Systems, 1997, 12(3), p. 1121-1128.
16. Yang Wang, Wenyuan Li, Jiping Lu, A new node voltage stability index based on local voltage phasors, Electric Power System Research, 2009, 79(1), p. 265-271.
17. Chakrabarti A., Kothari D. P., Mukhopadhyay A. K., Performance operation and control of EHV power transmission systems, India, A.H. Wheeler & Co. Ltd, 1995.
Appendix
Single line diagrams for 6-bus and practical WBSEB grid systems are shown in figures below
Figure A1. Six bus test system
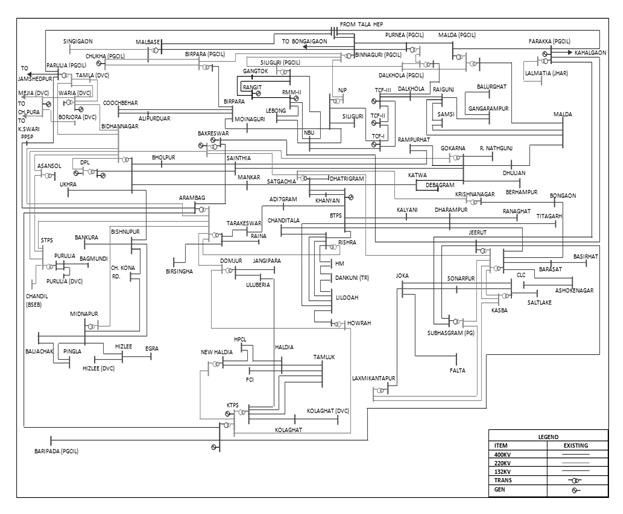
Figure A2. Typical Indian eastern grid (WBSEB 203-bus) system