Optimization and Characterization of Castor Seed Oil
Bagali S. SHRIDHAR, K. V. BEENA, M. V. ANITA, and K. B. PARAMJEET
Department of Chemical Engineering, Rural Engineering College, Hulkoti, Gadag, Karnataka, India
Corresponding author E-mail: shridhar_bagali@yahoo.com
Received: 1 June 2010 / Accepted: 21 December 2010 / Published: 30 December 2010
Abstract
The response surface methodology (RSM) was employed to optimize the dilution level and agitation time for castor oil extraction. The % recovery of oil was investigated with respect to two variable including dilution level (X1) and agitation time (X2). As a result, a polynomial regression model equation was fitted as follows: Y1 = 47.50 + 7.41 x1 + 2.08 x2 + 0.63 x1 x2 -16.62 x12 - 2.87 x2. The optimal dilution level and agitation time were found to be 7.3 and 2.38 hr respectively. The maximum extraction was found to be 48.75%. The characterization analysis revealed that tested parameters, which include specific gravity, acid value, viscosity, saponification value and iodine value results of castor oil produced, were compared with the ASTM standard specifications.
Keywords
Castor oil; Response Surface Methodology; Characterization
Introduction
Castor oil is derived from castor plant (Ricinus communis L.) represent a potential biproduct and used in many technical, medical and different industrial applications like bio-diesel productions [1]. Castor oil derivatives are used in the production of paints, varnishes, lacquers, and other protective coatings, lubricants and grease, hydraulic fluids, soaps, printing inks, linoleum, oil cloth and as a raw material in the manufacturing of various chemicals sebacic acid and undecylenic acid, used in the production of plasticizer and Nylon [2]. Castor oil has over 1000 industrial uses and because of this, its demand increases. A scientific investigation of the crop to improve its oil content will go a long way to meet up with the demand [3]. Castor oil is one of the few naturally occurring glycerides that approach being a pure compound, since the fatty acid portion is nearly nine-tenths ricinoleic. A crude Castor oil is a pale straw colour but turns colourless or slightly yellowish after refining and bleaching. The crude oil has distinct odour, but it can easily be deodorized in the refining process. Like any other vegetable oils and animal fats, it is a triglyceride, which chemically is a glycerol molecule with each of its three hydroxyl group esterified with a long clown fatty acid. Its major fatty acid is the unsaturated, hydroxylated 12-hydroxy, 9-octadecenoic acid, known familiarly as Ricinoleic acid. The fatty acid composition of a typical castor oil contains about 87% of ricinoleic acid [2].
The aim of the present research is to get a better understanding of the relation between the variables (dilution level and agitation time) and determine the optimum conditions for the extraction of castor oil. Response surface methodology (RSM) and Central composite design (CCD) which is an efficient statistical technique for optimization of multiple variables is applied to predict best performance conditions with minimum number of experiments and also study the characterization of castor seed oil.
Materials and Methods
Raw Material Preparation
The castor seeds undergo various processing in the course of its preparation for extraction. The unit operations involved are:
· Clearing: The castor seeds had some foreign materials and dirt which was separated by hand picking.
· Drying: The cleaned seeds were sun dried in the open, until the casing splits and sheds the seeds. The seeds were further dried in the oven at 60°C for 7 hrs to a constant weight in order to reduce its moisture content, which was initially at about 5 to 7%.
· Winnowing: The separation of the shell from the nibs (cotyledon) was carried out using tray to blow away the cover in order to achieve very high yield.
· Grinding (size reduction): Mortar and pestle were used to crush the seeds to obtain a size of 1.18 mm sieve size, in order to weaken or rupture the cell walls to release castor fat for extraction [2-3].
Determination of Moisture Content of the Seeds
50g of the cleaned sample was weighed and dried in an oven at 80°C for 7hrs and the weight was taken after every 2hrs. The procedure was repeated until a constant weight was obtained. After each 2 hours, the sample was removed from the oven and placed in the desiccator for 30 minutes to cool. It was then removed and re-weighed. The percentage moisture in the seed was calculated from the formula: Moisture = 100(W1- W2)/W1 %, where W1 = Original weight of the sample before drying; W2 = Weight of the sample after drying [2].
Experimental Design and Data Analysis: Central Composite Design (CCD)
RSM consists of a group of empirical techniques devoted to the evaluation of relations existing between a cluster of controlled experimental factors and the measured responses, according to one or more selected criteria. Prior knowledge and understanding of the process variables under investigation is necessary for achieving a realistic model.
The significant variables obtained by using statistical experimental design technique called the response surface methodology and central composite design was used. According to the Central composite design, the total number of treatment combinations was 2k + 2k + no where ‘k’ is the number of independent variables and no is the number of repetition of experiments at the center point. The total number of design points is thus N=2k + 2k + no. For statistical calculation, the variable Xi have been coded as xi according to the following transformation: xi = (Xi –Xo)/dX, Where xi is the dimensionless coded value of the independent variable Xi, Xo is the actual value of the independent variable Xi at the center point and X is the step change. A 2k _ factorial design with four axial points and six replicates at the center point with a total number of 13 experiments was employed for optimization of the medium components. The coded and actual values of the variables at various levels are given in Table 1.
The behavior of the system was explained by the following second order polynomial equation. Y = bo + Sbi xi + Sbii xi 2 + Sbij xi xj, where, Y = predicted response, bo = offset term, bi = linear effect, bii = squared effect, and bij = interaction effect. xi and xj = coded value of independent variables. The regression equation was optimized for maximum value to obtain the optimum conditions using MATLAB version 7.0 (Mathworks Inc., Natick, Massachusetts, USA) [4].
Table 1. Experimental range and levels of dilution level and agitation time in Central composite design (CCD)
|
Variable |
Parameter |
Level |
||||
|
-α |
-1 |
0 |
+1 |
+α |
||
|
x1 |
Dilution level |
1.55025 |
3 |
6.5 |
10 |
11.4497 |
|
x2 |
Agitation Time |
0.585786 |
1 |
2 |
3 |
3.41421 |
Table 2. Experimental data obtained for % recovery of oil
|
Run |
Dilution level x1(≡X1) |
Agitation Time x2(≡X2) |
% Recovery of Oil |
|
1 |
-1 (3.00) |
-1 (1.00) |
21.6 |
|
2 |
+1 (10.00) |
+1 (1.00) |
30.0 |
|
3 |
-1 (3.00) |
+1 (3.00) |
21.6 |
|
4 |
+1 (10.00) |
+1 (3.00) |
32.5 |
|
5 |
-1.414 (1.55) |
0 (2.00) |
1.67 |
|
6 |
+1.414 (11.45) |
0 (2.00) |
30.0 |
|
7 |
0 (6.50) |
-1.414 (0.59) |
38.3 |
|
8 |
0 (6.50) |
+1.414 (3.41) |
48.3 |
|
9 |
0 (6.50) |
0 (2.00) |
47.5 |
|
10 |
0 (6.50) |
0 (2.00) |
47.5 |
|
11 |
0 (6.50) |
0 (2.00) |
47.5 |
|
12 |
0 (6.50) |
0 (2.00) |
47.5 |
|
13 |
0 (6.50) |
0 (2.00) |
47.5 |
Experimental Methodology
A detailed methodology for the optimization process is given for run number 1 (Table 2). About 25g of castor seed sample was taken in a 250 ml conical flask. A required amount of hexane was added to the sample according to dilution level from Table 2 and was placed on a mechanical agitator.
The flask containing the mixture was subjected to a constant agitation and was maintained for agitation time as per experimental plan given in Table 2. The sample extract along with hexane, obtained after the period of agitation was filtered and the mixture was further subjected to simple distillation to separate hexane from extracted oil. During this process, the extract sample was taken into a round bottom flask and was placed on a heater. The flask was connected to a condenser and a conical flask was placed at the end of the condenser to collect the hexane. After fixing the set up, heater was turned on and the sample was allowed to boil. At 60oC the hexane gets vaporized, which was passed through condenser and hexane was recovered. The oil extract left behind in the flask was further subjected to evaporation and then cooled in the desiccators, and weighed using Mettler electronic balance [5]. Weight of oil = (Weight of flask + oil) - (Weight of empty flask); % recovery of oil = (Weight of oil / Weight of sample) × 100
Characterization of the Extracted Castor Oil
Determination of Acid Value
25ml of diethyl ether and 25ml of ethanol was mixed in a 250ml beaker. The resulting mixture was added to 10g of oil in a 250ml conical flask and few drops of phenolphthalein were added to the mixture. The mixture was titrated with 0.1M NaOH to the end point with consistent shaking for which a dark pink colour was observed and the volume of 0.1M NaOH (V0) was noted. Free Fatty Acid (FFA) was calculated as: V0/W0·2.82·100, where 100ml of 0.lM NaOH = 2.83g of Oleic acid, W0 = sample weight; then Acid Value = FFA·2 [2-6].
Determination of Saponification Value
Indicator method was use as specified by ISO 3657 (1988). 2g of the sample was weighed into a conical flask; 25ml of 0.1N ethanolic potassium hydroxide of was then added. The content which was constantly stirred was allowed to boil gently for 60min. A reflux condenser was placed on the flask containing the mixture. Few drops of phenolphthalein indicator was added to the warm solution and then titrated with 0.5M HCl to the end point until the pink colour of the indicator just disappeared. The same procedure was used for other samples and blank. The expression for saponification value (S.V.) is given by: S.V = 56.1 N(V0-V1)/M, where V0 = the volume of the solution used for blank test; VI = the volume of the solution used for determination; N = Actual normality of the HCl used; M = Mass of the sample [2-6].
Determination of Iodine Value
The method specified by ISO 3961 (1989) was used. 0.4g of the sample was weighed into a conical flask and 20ml of carbon tetra chloride was added to dissolve the oil. Then 25ml of Dam’s reagent was added to the flask using a safety pipette in fume chamber. Stopper was then inserted and the content of the flask was vigorously swirled. The flask was then placed in the dark for 2 hours 30 minutes. At the end of this period, 20ml of 10% aqueous potassium iodide and 125ml of water were added using a measuring cylinder. The content was titrated with 0.1M sodium-thiosulphate solutions until the yellow colour almost disappeared. Few drops of 1% starch indicator was added and the titration continued by adding thiosulphate drop wise until blue coloration disappeared after vigorous shaking. The same procedure was used for blank test and other samples. The iodine value (I.V) is given by the expression: I.V = 12.69 C(V1-V2)/M, where C = Concentration of sodium thiosulphate used; V1 = Volume of sodium thiosulphate used for blank; V2 = Volume of sodium thiosulphate used for determination, M = Mass of the sample [2-6].
Determination of Specific Gravity
Density bottle was used to determining the density of the oil. A clean and dry bottle of 25ml capacity was weighed (W0) and then filled with the oil, stopper inserted and reweighed to give (W1). The oil was substituted with water after washing and drying the bottle and weighed to give (W2). The expression for specific gravity (Sp.gr) is: Sp.gr = (W1-W0)/(W2-W0) = Mass of the substance / Mass of an equal volume of water [2].
Determination of Viscosity
A clean, dried viscometer with a flow time above 200 seconds for the fluid to be tested was elected. The sample was filtered through a sintered glass (fine mesh screen) to eliminate dust and other solid material in the liquid sample. The viscosity meter was charged with the sample by inverting the tube’s thinner arm into the liquid sample and suction force was drawn up to the upper timing mark of the viscometer, after which the instrument was turned to it’s normal vertical position. The viscometer was placed into a holder and inserted to a constant temperature bath set at 29°C and allowed approximately 10 minutes for the sample to come to the bath temperature at 29°C. The suction force was then applied to the thinner arm to draw the sample slightly above the upper timing mark. The afflux time by timing the flow of the sample as it flow freely from the upper timing mark to the lower timing mark was recorded [2].
Determination of pH Value
2g of the sample was poured into a clean dry 25ml beaker and 13ml of hot distilled water was added to the sample in the beaker and stirred slowly. It was then cooled in a cold- water bath to 25°C. The pH electrode was standardized with buffer solution and the electrode immersed into the sample and the pH value was read and recorded [2].
Result and Discussion
Optimization of Process Conditions like Dilution Level and Agitation Time
The optimization of process conditions affecting the % recovery of oil were carried out for the maximum extraction of oil from castor seed using central composite design (CCD) method.
13 experiments with different combinations of dilution level and agitation time were performed. The % recovery of oil was determined; results are shown in Table 2.
A detailed analysis on the interaction of dilution level and agitation time on the % recovery of oil from castor seed has been done. The ‘Design-Expert (Stat-Ease, Inc., Minneapolis USA) software was used for regression and graphical analysis of the data obtained. The optimal values of the experimental conditions were obtained by solving the regression equation and also by analyzing the response surface and contour plots.
The application of response surface methodology offers, in the basics of parameter estimate, an empirical relationship between the response variable and the test variables under consideration. Multiple regression analysis of the experimental data (using design expert software) gave the following second order polynomial equation on terms of castor oil extraction. Y1 = 47.50 + 7.41 x1 + 2.08 x2 + 0.63 x1 x2 -16.62 x12 - 2.87 x2, where Y1 is the response variable in terms of castor oil extraction and x1 and x2 the coded values of the independent variables i.e., dilution level and agitation time respectively.
The independent and the dependent variables were fitted to the second-order model equation. They were examined in terms of the goodness of fit. The goodness of fit of the regression equation Y1 was evaluated by the coefficient of determination (R2) and the coefficient of relation (R). The coefficient of determination (R2) is a measure of total variation of observed values of extracted oil about the mean explained by the fitted model. The coefficient of correlation (R) explains the correlation between the experimental and predicted values from the model. A good model equation explains most of the variations in the response. The coefficient of determination (R2) for castor oil extraction is 0.9634. This value indicates that the response model can explain 96.34% of the total variability in the responses. The coefficient of correlation (R) for oil extraction is 0.9815.The closer value of coefficient of correlation (R) to unity is the better. Statistical testing of the model was done in the form of variance (ANOVA), which is required to test the significance and adequacy of the model. The reliability of the suggested model was tested using the Fisher’s statistical test (F). The summary of the Analysis of Variance (ANOVA) obtained from the Design-Expert software corresponding to equation Y1 for % recovery of oil is shown in Table 2.
Table 3. Determination of moisture content
|
Time (hr) |
0 |
2 |
4 |
6 |
7 |
|
Weight (g) |
50 |
48.3 |
47.2 |
47.1 |
47.1 |
|
Percentage of moisture content = 5.8 % |
|||||
The mean squares in the Table 4 are obtained by dividing the sum of squares of each of the two sources of variation (model and error variance) by the respective degrees of freedom. The F value, known as Fisher variance ratio provides the information on how well the factors describe the statistical variation in the data from its mean. It is calculated by dividing mean square due to model variance to the mean square due to the error. Generally, the calculated F value must be several times greater than the F value obtained from the standard distribution table, if the model is good prediction of the experimental results.
Table 4. Analysis of variance (ANOVA) table for the effect of dilution level and agitation time on % recovery of oil
|
Source |
Sum of Squares |
Degree of Freedom |
Mean square |
F value |
P value (Probability) P>F |
|
Model |
2399.28 |
5 |
479.86 |
36.88 |
<0.0001 significant |
|
Residual |
91.07 |
7 |
13.01 |
||
|
Total |
2490.35 |
12 |
|
Values of “probability (P) > F” less than 0.05 indicate that the model terms are significant. The ANOVA of the regression model corresponding to quadratic equation Y1 for the % recovery of oil demonstrates that the model is highly significant, as it is evident from the calculated F-value(=36.88) and a very low probability value (probability (P)>F=0.0001). Moreover the computed F-value (F=36.88) is much greater than the F value (F0.005 (5,7)=9.52) obtained from the standard distribution values [4].
Both response surface and isoresponse contour plots are parts of data presentation from response surface methodology. The isoresponse contour plots are shown in the Figure 1. For the chosen model equation Y1, illustrates the two dimensional relationship for the effects of dilution level and agitation time respectively, on extraction. These constant levels are at the central levels of that variable in their respective ranges. It is apparently, one can understand the interaction between two parameters and predict their optimal levels.
The response plots shown in Figure 2 for the chosen model equation Y1, illustrates three three-dimensional relationship for the effects of dilution level and agitation time on the % recovery of oil. These constant levels are at the central levels of that variable in their respective ranges. The response surface indicates that, the variable respective ranges. The response surfaces indicate that, % recovery of oil increase as dilution level and agitation time increase to the optimum conditions and then declined with the further increase of those factors. This result indicates that two variables had mutually dependent influence on the % recovery of oil.
The stationary point was observed in all isoresponse contour plots of the % recovery of oil. At stationary point or centroid point the slope of the response surface is zero when taken in all direction. The coordinates of this point are called the coordinates of stationary points. The contour plots of extraction which shown in Figure 1, are elliptical in the nature. The maximum output point was attained at the center when moving along the major and minor axes of ellipse.
The elliptical natures of the contour plot also indicate the mutual interactions between these set off variables has significant effect on the % recovery of oil. The maximum was achieved at the center point of the ellipse. It can be observed that the maximum % recovery of oil obtained from Figure 1 and the value of % recovery of oil for this contour plot is 48.75.
This is equally validated with the results obtained from the MATLAB. The optimal dilution level and agitation time were found to be 7.3 and 2.38 hr respectively. The optimum coded value of dilution level and agitation time obtained are substituted in the polynomial/ regression equation Y1 and the maximum extraction was found out. The maximum extraction was found to be 48.75%.
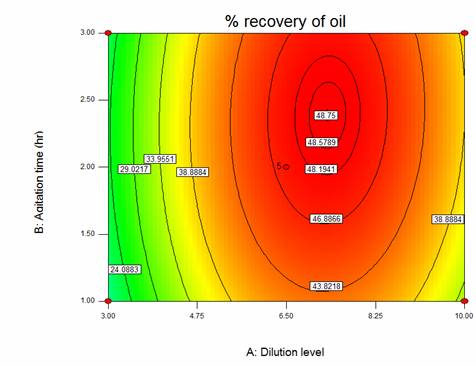
Figure 1. Isoresponse contour plots showing the effect of dilution level and agitation time and their interactive effect on the % recovery of oil.
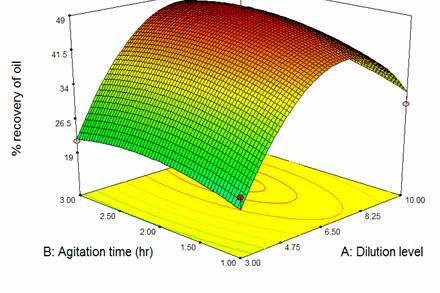
Figure 2. Response surface plots showing effect of dilution level and agitation time and their interactive effect on the % recovery of oil.
Table 5. ASTM Specification for Quality Castor Oil
|
Property |
Ranges |
Experimental Results |
|
Acid Value |
0.4-4.0 |
2.2 |
|
Saponification Value |
175-187 |
181 |
|
Iodine Value |
82-88 |
87 |
|
Specific Gravity 20/25°C |
0.957-0.968 |
0.95 |
|
Viscosity at 25°C |
6.3-8.8 St |
6.9 |
The results obtained for the percentage moisture content, 5.8% (Table 3) shows a variation from the report who reported a moisture content of the range of 5 to 7 percent. The result obtained from the percentage oil content 48.75% fall within the range of the percentage oil content (30 - 55%) of castor beans found in literature [2], depending on the variety. The optimal dilution level and agitation time were found to be 7.3 and 2.38 hr respectively. The maximum extraction was found to be 48.75%. Acid value, Saponification value, Iodine value, Specific gravity and Viscosity results are compared with ASTM values as shown in Table 5 [2]. Also, the pH value of the oil was found to be 6.0.
Conclusion
The study has demonstrated the use of a central composite design by determining the conditions leading to the optimum yield of castor oil extraction. The optimal conditions are dilution level equal to 7.3 and agitation time equal to 2.38. This methodology could therefore be successfully employed to any process, where an analysis of the effects and interactions of many experimental factors are referred. Response surface plots are very helpful in visualizing the main effects and interaction of its factors. Thus, smaller and less time consuming experimental designs could generally suffice the optimization of many industrial processes.
References
1. Amara A.A., Salem S.R., Degradation of Castor Oil and Lipase Production by Pseudomonas aeruginosa, American-Eurasian J. Agric. & Environ. Sci., 2009, 5(4), p. 556-563.
2. Akpan U.G., Jimoh A., Mohammed A.D., Extraction, Characterization and Modification of Castor Seed Oil, Leonardo Journal of Sciences, 2006, 8, p. 43-52.
3. Sepidar S., Zurina Z.A., Robiah Y., Azhari M., Extraction of Oil From Jatropha Seeds – Optimization and Kinetics, American Journal of Applied Science, 2009, 6(7), p. 1390-1395.
4. Khuri A.I., Cornell J.A., Response surface designs and analysis using Statistics: Text books and monographs, New York, Marcel Dekkar, 1987.
5. Okoh J.O., Ojo A.A., and Vange T., Combining Ability and Heterosis of Oil Content in Six Accessions of Castor at Makurdi, Nature and Science, 2007, 5(4), p. 18-23.
6. Kyari M.Z., Extraction and characterization of seed oils, Int. Agrophysics, 2008, 22, p. 139-142.