Rate Modelling of Alkali Gelatinization at Low Conversions
Osoka Emmanuel CHIBUIKE
Department of Chemical Engineering, Federal University of Technology P.M.B. 1526, Owerri-Imo State, Nigeria.
E-mail: emmaosoka@yahoo.com
Received: 30 March 2010 / Accepted: 20 December 2010 / Published: 30 December 2010
Abstract
The rate of starch gelatinisation under strong alkali conditions was modeled at low conversion (x < 0.4), with the degree of gelatinisation (conversion) defined in terms of sample viscosity. Experimental data at low conversion were fit to eleven rate models based on the mechanism of the unreacted-core model and the rate controlling steps determined. Film diffusion (stokes regime) plus Product layer diffusion steps control the rate of reaction for all sodium hydroxide concentrations and at low conversion (x < 0.4), with the dominance shifting from Film diffusion to Product layer diffusion as sodium hydroxide concentration is increased.
Keywords
Starch; Gelatinisation; Viscosity; Fluidity; Rheological; Equilibrium
Introduction
Starch is one of the most common substances existing in nature and is the major basic constituent of the average diet. The most important practical property of starch is its gelatinisation under the influence of heat and/or certain chemical in an aqueous medium to give starch paste.
The chemical gelatinisation of starch-under strong alkali conditions is the basic industrial reaction in the conversion of starch to adhesives (glue) [1-4].
The rate of starch gelatinisation under strong alkali conditions has be studied rheologically, with the degree of gelatinisation defined in terms of viscosity and modeled on the mechanism of the unreacted-core model. Two steps at most are rate controlling [5-9]. The shift in the rate controlling step with conversion makes it needful to study the rate data presented in our earlier work at different conversion levels.
The aim of this research is to develop a model for starch gelatinization under strong alkali conditions that will be useful in predicting viscosity and by extension, bond streght of starch base adhesives.
Material and Method
The following model equations apply as given below:
One-Step Controls
A1 Diffusion through fluid film controls (stokes regime)
|
(t-tdA1) = τF1(1-(1-x)2/3) |
(1) |
A2 Diffusion through fluid film controls (non-stokes regime)
|
(t-tdA2) = τF2(1-(1-x)1/2) |
(2) |
B Diffusion through Product layer controls
|
(t-tdB) = τp (1-3(1-x)2/3 + 2(1-x)) |
(3) |
C Chemical reaction controls
|
(t-tdC) = τC (1-(1-x)1/3) |
(4) |
Two-Step Controls
D1 Film diffusion plus Product layer controls (stokes regime)
|
(t-tdD1) = τF1 (1-(1-x)2/3) + τP (1-3(1-x)2/3+2(1-x)) |
(5) |
D2 Film diffusion plus Product layer controls (non-stokes regime)
|
(t-tdD2) = τF2 (1-(1-x)1/2) + τP (1-3(1-x)2/3+2(1-x)) |
(6) |
E1 Film diffusion plus Chemical reaction controls (stokes regime)
|
(t-tdE1) = τF1 (1-(1-x)2/3) + τC (1-(1-x)1/3) |
(7) |
E2 Film diffusion plus Chemical reaction controls (non-stokes regime)
|
(t-tdE2) = τF2 (1-(1-x)1/2) + τC (1-(1-x)1/3) |
(8) |
F Product layer diffusion plus Chemical reaction controls
|
(t-tdF) = τp (1-3(1-x)2/3 +2(1-x)) + τC (1-(1-x)1/3) |
(9) |
Three-Step Controls
G1 Film diffusion plus Product layer plus Chemical reaction controls (stokes regime)
|
(t-tdG1) = τF1 (1-(1-x)2/3) +τp (1-3(1-x)2/3+2(1-x))+ τC (1- (1-x)1/3) |
(10) |
G2 Film diffusion plus Product layer plus Reaction controls (non-stokes regime)
|
(t-tdG2) = τF2 (1-(1-x)1/2)+τp (1-3(1-x)2/3+2(1-x))+ τC (1- (1-x)1/3) |
(11) |
These rate equations (Eq. 1 Eq. 11) can be used with the MATLAB curve fitting toolbox without modification, for analysis of experimental data.
Results and Discussion
The experimental results are presented in Table 1-7. Graphical representations of the models are presented in Figures 1-3.
Table 1. Numerical fit Results for 17g/dm3 NaOH Concentration at low conversion
|
Model |
td(secs) |
tF1(secs) |
tF2(secs) |
tP(secs) |
tC(secs) |
R2 |
RMSE |
SSE |
|
A1 |
186.7 |
272.1 |
|
|
|
0.9983 |
0.863 |
2.981 |
|
A2 |
187.8 |
|
344.9 |
|
|
0.9977 |
1.013 |
4.108 |
|
B |
209.4 |
|
|
927 |
|
0.9649 |
3.917 |
61.37 |
|
C |
188.9 |
|
|
|
491.6 |
0.9969 |
1.168 |
5.456 |
|
D1 |
186.7 |
272.1 |
|
1.21E-7 |
|
0.9983 |
0.863 |
2.981 |
|
D2 |
187.8 |
|
344.9 |
1.39E-7 |
|
0.9977 |
1.013 |
4.108 |
|
E1 |
186.7 |
272.1 |
|
|
3.46E-11 |
0.9983 |
0.863 |
2.981 |
|
E2 |
187.8 |
|
344.9 |
|
4.33E-7 |
0.9977 |
1.013 |
4.108 |
|
F |
188.9 |
|
|
1.03E-7 |
491.6 |
0.9969 |
1.168 |
5.456 |
|
G1 |
186.7 |
272.1 |
|
3.42E-13 |
1.65E-11 |
0.9983 |
0.863 |
2.981 |
|
G2 |
187.8 |
|
344.9 |
3.69E-8 |
2.27E-14 |
0.9977 |
1.013 |
4.108 |
Table 2. Numerical fit Results for 18g/dm3 NaOH Concentration at low conversion
|
Mode1 |
td(secs) |
tF1(secs) |
tF2(secs) |
tP(secs) |
tC(secs) |
R2 |
RMSE |
SSE |
|
A1 |
149.4 |
304.8 |
|
|
|
0.9985 |
1.025 |
6.31 |
|
A2 |
150.2 |
|
389.9 |
|
|
0.9979 |
1.225 |
9.005 |
|
B |
168.1 |
|
|
1231 |
|
0.9386 |
6.555 |
257.8 |
|
C |
150.9 |
|
|
|
560.8 |
0.9970 |
1.440 |
12.45 |
|
D1 |
149.4 |
304.8 |
|
3.63E-11 |
|
0.9985 |
1.025 |
6.31 |
|
D2 |
150.2 |
|
389.9 |
1.15E-7 |
|
0.9979 |
1.225 |
9.005 |
|
E1 |
149.4 |
304.8 |
|
|
3.46E-12 |
0.9985 |
1.025 |
6.31 |
|
E2 |
150.2 |
|
389.9 |
|
1.19E-7 |
0.9979 |
1.225 |
9.005 |
|
F |
150.9 |
|
|
5.36E-10 |
560.8 |
0.9970 |
1.44 |
12.45 |
|
G1 |
149.4 |
304.8 |
|
1.02E-9 |
2.47E-14 |
0.9985 |
1.025 |
6.31 |
|
G2 |
150.2 |
|
389.9 |
1.71E-8 |
6.18E-10 |
0.9979 |
1.225 |
9.005 |
Table 3. Numerical fit Results for 19g/dm3 NaOH Concentration at low conversion
|
Model |
td(secs) |
tF1(secs) |
tF2(secs) |
tP(secs) |
tC(secs) |
R2 |
RMSE |
SSE |
|
A1 |
107.7 |
257.7 |
|
|
|
0.9903 |
2.327 |
27.07 |
|
A2 |
108.2 |
|
330.9 |
|
|
0.9886 |
2.529 |
31.98 |
|
B |
121 |
|
|
1128 |
|
0.8924 |
7.761 |
301.2 |
|
C |
108.7 |
|
|
|
477.7 |
0.9867 |
2.733 |
37.35 |
|
D1 |
107.7 |
257.7 |
|
2.79E-12 |
|
0.9903 |
2.327 |
27.07 |
|
D2 |
108.2 |
|
330.9 |
2.36E-11 |
|
0.9886 |
2.529 |
31.98 |
|
E1 |
107.7 |
257.7 |
|
|
1.25E-9 |
0.9903 |
2.327 |
27.07 |
|
E2 |
108.2 |
|
330.9 |
|
9.65E-5 |
0.9886 |
2.828 |
31.98 |
|
F |
108.7 |
|
|
5.33E-11 |
477.7 |
0.9867 |
2.733 |
37.35 |
|
G1 |
107.7 |
257.7 |
|
8.65E-7 |
4.88E-5 |
0.9903 |
2.602 |
27.07 |
|
G2 |
108.2 |
|
330.9 |
9.54E-8 |
2.22E-14 |
0.9886 |
2.529 |
31.98 |
Table 4. Numerical fit Results for 20g/dm3 NaOH Concentration at low conversion
|
Model |
td(secs) |
tF1(secs) |
tF2(secs) |
tP(secs) |
tC(secs) |
R2 |
RMSE |
SSE |
|
A1 |
80.46 |
233.7 |
|
|
|
0.9995 |
0.4853 |
0.9421 |
|
A2 |
81.36 |
|
296.4 |
|
|
0.9998 |
0.3289 |
0.4328 |
|
B |
99.06 |
|
|
796.2 |
|
0.9742 |
3.359 |
45.13 |
|
C |
82.24 |
|
|
|
422.6 |
0.9999 |
0.2492 |
0.2484 |
|
D1 |
82.42 |
208.2 |
|
89.67 |
|
0.9999 |
0.2843 |
0.2425 |
|
D2 |
82.38 |
|
278.6 |
49.15 |
|
0.9999 |
0.2853 |
0.2441 |
|
E1 |
82.24 |
1.136e-8 |
|
|
422.6 |
0.9999 |
0.2492 |
0.2484 |
|
E2 |
82.24 |
|
5.51E-8 |
|
422.6 |
0.9999 |
0.2492 |
0.2484 |
|
F |
82.32 |
|
|
3.845 |
420.6 |
0.9999 |
0.2871 |
0.2474 |
|
G1 |
82.53 |
206.7 |
|
94.71 |
5.80E-4 |
0.9999 |
0.3498 |
0.2447 |
|
G2 |
82.38 |
|
278.6 |
49.15 |
2.51E-6 |
0.9999 |
0.3494 |
0.2441 |
Table 5. Numerical fit Results for 21g/dm3 NaOH Concentration at low conversion
|
Model |
td(secs) |
tF1(secs) |
tF2(secs) |
tP(secs) |
tC(secs) |
R2 |
RMSE |
SSE |
|
A1 |
54.49 |
235.4 |
|
|
|
0.9979 |
1.081 |
5.839 |
|
A2 |
55.06 |
|
300.6 |
|
|
0.9971 |
1.274 |
8.116 |
|
B |
68.76 |
|
|
908.1 |
|
0.9305 |
6.237 |
194.5 |
|
C |
55.63 |
|
|
|
431.5 |
0.9961 |
1.482 |
10.98 |
|
D1 |
54.49 |
235.4 |
|
7.08E-10 |
|
0.9979 |
1.081 |
5.839 |
|
D2 |
55.06 |
|
300.6 |
2.07E-11 |
|
0.9971 |
1.274 |
8.116 |
|
E1 |
54.49 |
235.4 |
|
|
4.14E-11 |
0.9979 |
1.081 |
5.839 |
|
E2 |
55.06 |
|
300.6 |
|
7.13E-10 |
0.9971 |
1.274 |
8.116 |
|
F |
55.63 |
|
|
3.63E-12 |
431.5 |
0.9961 |
1.482 |
10.98 |
|
G1 |
54.49 |
235.4 |
|
5.55E-12 |
2.39E-10 |
0.9979 |
1.081 |
5.839 |
|
G2 |
55.06 |
|
300.6 |
8.73E-9 |
3.08E-7 |
0.9971 |
1.274 |
8.116 |
Table 6. Numerical fit Results for 22g/dm3 NaOH Concentration at low conversion
|
Model |
td(secs) |
tF1(secs) |
tF2(secs) |
tP(secs) |
tC(secs) |
R2 |
RMSE |
SSE |
|
A1 |
14.97 |
148.1 |
|
|
|
0.9990 |
0.5226 |
0.8195 |
|
A2 |
15.26 |
|
189.6 |
|
|
0.9994 |
0.4087 |
0.5011 |
|
B |
22.87 |
|
|
608.9 |
|
0.9637 |
3.148 |
29.73 |
|
C |
15.56 |
|
|
|
272.9 |
0.9996 |
0.3270 |
0.3208 |
|
D1 |
15.81 |
131.1 |
|
73.03 |
|
0.9996 |
0.3859 |
0.2978 |
|
D2 |
15.8 |
|
175.2 |
48.13 |
|
0.9996 |
0.3829 |
0.2933 |
|
E1 |
15.56 |
7.39E-8 |
|
|
272.9 |
0.9996 |
0.3270 |
0.3208 |
|
E2 |
15.56 |
|
1.23E-5 |
|
272.9 |
0.9996 |
0.4005 |
0.3208 |
|
F |
15.78 |
|
|
20.81 |
263.9 |
0.9997 |
0.3777 |
0.2853 |
|
G1 |
15.63 |
8.71E-3 |
|
5.78 |
270.2 |
0.9996 |
0.5514 |
0.304 |
|
G2 |
15.78 |
|
2.22E-14 |
20.81 |
263.9 |
0.9997 |
0.3777 |
0.2853 |
Table 7. Numerical fit Results for 23g/dm3 NaOH Concentration at low conversion
|
Model |
td(secs) |
tF1(secs) |
tF2(secs) |
tP(secs) |
tC(secs) |
R2 |
RMSE |
SSE |
|
A1 |
2.854 |
124.7 |
|
|
|
0.9963 |
0.8291 |
1.375 |
|
A2 |
3.151 |
|
159.5 |
|
|
0.9972 |
0.7227 |
1.045 |
|
B |
10.33 |
|
|
506.7 |
|
0.9860 |
1.606 |
5.157 |
|
C |
3.444 |
|
|
|
229.3 |
0.9979 |
0.6164 |
0.760 |
|
D1 |
5.281 |
82.88 |
|
173.6 |
|
0.9999 |
0.1597 |
0.026 |
|
D2 |
5.272 |
|
110.8 |
157.8 |
|
0.9999 |
0.1581 |
0.025 |
|
E1 |
3.444 |
2.16E-9 |
|
|
229.3 |
0.9979 |
0.6164 |
0.760 |
|
E2 |
3.444 |
|
1.11E-10 |
|
229.3 |
0.9979 |
0.6164 |
0.760 |
|
F |
5.258 |
|
|
140.5 |
166.9 |
0.9999 |
0.1552 |
0.024 |
|
G1 |
5.296 |
2.861e-4 |
|
143.3 |
165.7 |
0.9999 |
|
0.0244 |
|
G2 |
5.258 |
|
7.008e-6 |
140.5 |
166.9 |
0.9999 |
|
0.0241 |
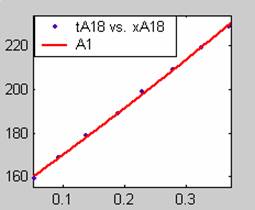
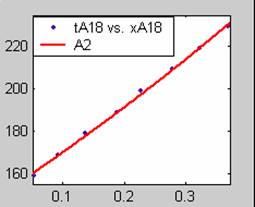
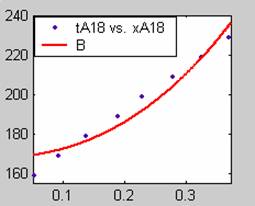
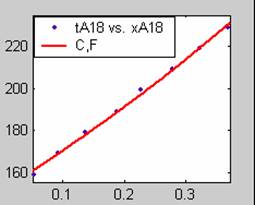
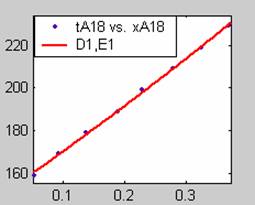
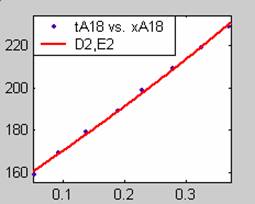
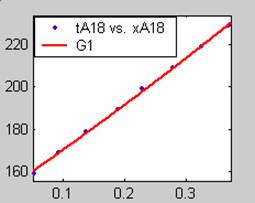
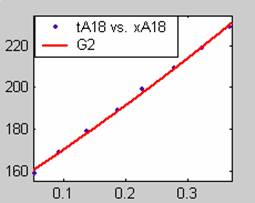
Figure 1. Low Conversion against time (secs) for all rate models (18g/dm3 NaOH Conc.)
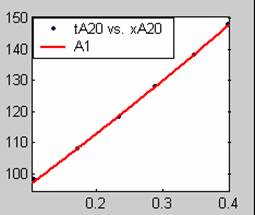
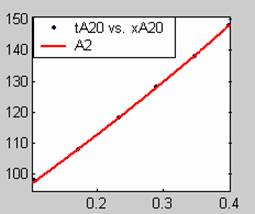
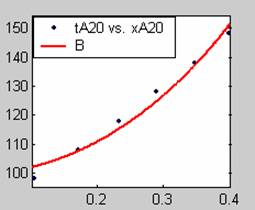
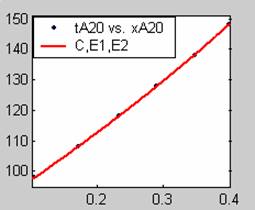
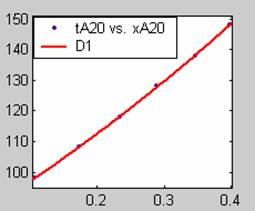
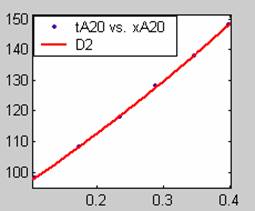
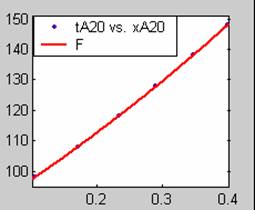
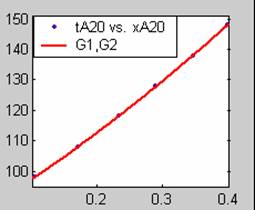
Figure 2. Low Conversion against time (secs) for all rate models (20g/dm3 NaOH Conc.)
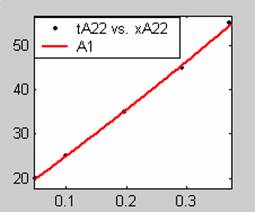
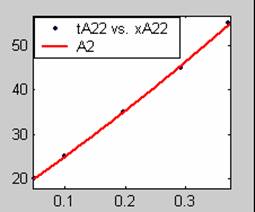
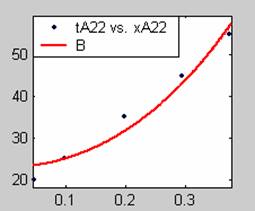
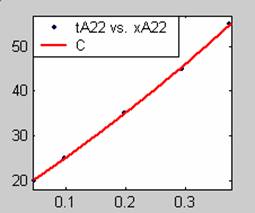
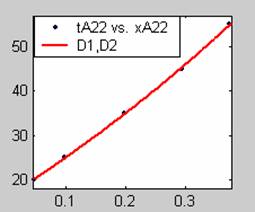
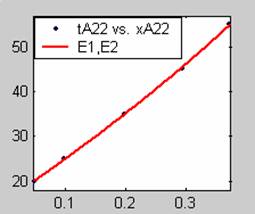
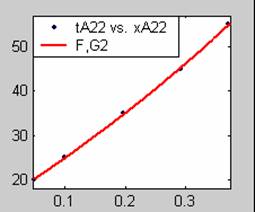
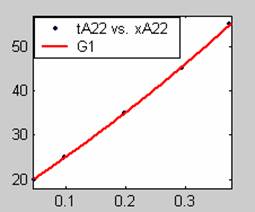
Figure 3. Low Conversion against time (secs) for all rate models (22g/dm3 NaOH Conc.)
All the models gave good fit for data obtained using sodium hydroxide concentration of 17g/dm3, except the model for Product layer diffusion control (B). The numerical fits show that the model for Film diffusion control, under stokes regime (A1) gave the best fit (R2 = 0.9983). The Two-Step and Three-Step control models do not improve the numerical fits and values of time for complete conversion show that only One-Step Film diffusion dominates, with other steps having values of time for complete conversion approximately equal to zero.
Fit results for data obtained using sodium hydroxide concentration of 18g/dm3 also show that the Film diffusion step alone controls the rate. The model for Film diffusion control, under stokes regime (A1) gives the best fit (R2 = 0.9985). Two-Step and Three-Step control models do not improve the fit results.
Fit results for data obtained using sodium hydroxide concentration of 19g/dm3also show that the Film diffusion step alone controls the rate. The model for Film diffusion control, under stokes regime (A1) gives the best fit (R2 = 0.9903) and the Two-Step and Three-Step models offer no improvement.
All models gave very good fit results for data obtained using sodium hydroxide concentration of 20g/dm3 except the model for Product layer diffusion control (B). The One-Step control model that gave the best fit was Chemical reaction control (C), followed closely by film diffusion control under non-stokes regime (A2) and Film diffusion control under stokes regime (A1) with R2 values of 0.9999, 0.9998 and 0.9995 respectively.
The Two-Step control models offer some improvement with the Chemical reaction control step dominating, while the Three-Step control models gave poorer numerical fits than the Two-Step control models. Therefore two steps, at most, will be rate-controlling.
Fit results from data obtained using sodium hydroxide concentration of 21g/dm3 show that Film diffusion alone controls the rate. Two-Step and Three-Step control models gave no improvement of the numerical fits. All other steps had values of time for complete conversion approximately equal to zero. The model for Film diffusion control, under stokes regime (A1) gave the best fit (R2 = 0.9979).
All the models gave good fit results for data obtained using sodium hydroxide concentration of 22g/dm3 except the model for Product layer diffusion control (B). The One-Step control model that gave the best fit was Chemical reaction control (C) with R2 = 0.9996. The Two-Step control models offer some improvement to the fit with the model for Product layer diffusion plus Chemical reaction control (F) giving the best fit (R2 = 0.9997). The Three-Step control models offer no improvement of the fit results.
For data obtained using sodium hydroxide concentration of 23g/dm3, all the models gave good fit results except the model for Product layer diffusion control (B). The One-Step control model that gave the best fit was Chemical reaction control (C) with R2 = 0.9979. The Two-Step control models offer some improvement to the fit with the model for Product layer diffusion plus Chemical reaction control (F) giving the best fit (R2 = 0.9999). The Three-Step control models offer little improvement to the graphical and numerical fit results, but also show that Product layer diffusion and Chemical reaction steps dominate.
No One-Step control model gave the bets fit to data for all concentrations of sodium hydroxide used. The model for Film diffusion, under stokes regime (A1) gave the best fit at low concentrations of sodium hydroxide, with its associated Two-Step control models (D1 and E1) having similar fit results.
At higher values of sodium hydroxide concentration, where Product layer diffusion and Chemical reaction steps play a prominent role, the models for Product layer diffusion plus Chemical reaction control (F) offer the best fit, with fit results very close to those of D1 and D2.
Therefore Two-Step control model for Film diffusion (stokes regime) plus Product layer diffusion control (D1) gives the overall best fit for low conversion data obtained for all sodium hydroxide concentrations. Its fit results show that Film diffusion dominates at low sodium hydroxide concentrations, while Product layer diffusion dominates at higher sodium hydroxide concentrations.
Starch gelatinisation under strong alkali conditions is a heterogeneous (fluid-particle) reaction based on the mechanism of the unreacted-core model. The individual granules adsorb alkali and gelatinise when the amount of adsorbed alkali exceeds a certain threshold concentration [1, 10].
Conclusion
Two steps at most control the rate of the process for all concentrations of sodium hydroxide studied. Film diffusion (stokes regime) plus Product layer diffusion steps control the rate of reaction for all sodium hydroxide concentrations and at low conversion (x < 0.4), with the dominance shifting from Film diffusion to Product layer diffusion as sodium hydroxide concentration is increased.
The model equation for this is given as:
(t-tdD1) = τF1(1-(1-x)2/3)+τ(1-3(1-x)2/3 + 2(1-x))
It is recommended that the model from this work be used to effectively study the effect of variables like: water-starch ratios and rate of agitation on the kinetics of starch gelatinisation under strong alkali conditions, so as to develop a robust model that can be used to optimize the process of producing adhesives from (cassava) starch.
References
1. Leach H.W. Gelatinisation of Starch, In R.W. Whistler, E.F. Paschall and J.M. Bemiller, Starch: Chemistry and Technology, vol. 1, 2nd ed., New York, Academic Press, 1965, pp. 289-307.
2. Austin G.T. Shreves Chemical Process Industries, 5th Edition, McGraw-Hill Book Company, 1985, pp. 456-458.
3. Halley P., Sopade P. Starch Gelatinisation, CHEE 4007 Individual Inquiry B, Department of Chemical Engineering, The University of Queensland, 2004.
4. *** www.cerestar.com [online] 2004 [Accessed December 2009] A Glossary of Terms and Products for the Starch Industry, Cargill Cerestar, 2004.
5. Yagi S., Kunii D., A Paper Presented at the 5th International Symposium of Combustion, Reinhold, New York, 1955, pp. 231.
6. Yamamoto H., Makita E. Oki Y., Otani M., Flow Characteristics and Gelatinisation Kinetics of Rice Starch Under Strong alkali Conditions, Food Hydrocolloids, 2006, 20(1), pp. 9-20.
7. Levenspiel O., Chemical Reaction Engineering, 3rd ed., John Wiley and Sons Inc., New York, 2006, pp. 567-580.
8. Osoka E.C., Njiribeako A.I., Olebunne F.L., A Rheological study of starch gelatinization under strong alkali conditions, Proceedings of the 38th Annual Conference of NSChE, 30th October 1st November, 2008, Effurun, Nigeria.
9. Osoka E.C., Njiribeako A.I., Rate modelling of starch gelatinization under strong alkali conditions (In Press), 2009.
10. Mangels C.E., Bailey C.H. Chemical Gelatinisation of Starch, J. Am. Chem. Soc., 1933, 55, p. 1931.