Morphology and Composition of Nanocrystalline Stabilized Zirconia using Sem-Eds System
Tajudeen Oladele AHMED1,*, Patrick Ovie AKUSU1, Sunday Adesunloye JONAH2, and Rabiu NASIRU1
1Department of Physics ABU,
2Centre for Energy Research and
Training, ABU,
*Corresponding author E-mail: tajahmol@yahoo.co.uk
Abstract
Bismuth oxide of known mole percentages has been incorporated into zirconia matrix via co-precipitation method. The co-precipitated powders containing mixed oxides of bismuth and zirconium are dried and calcined in air at 200°C and 800°C respectively to obtain nanosized-stabilized zirconia. The microstructures and the composition of the nanosized-stabilized zirconia are investigated using Scanning Electron Microscopy (SEM) coupled with Energy Dispersive X-ray Spectroscopy (EDS) at a low accelerating voltage of 5kV. The results revealed that the powders are homogenously sintered with particle size having typical dimensions in the range of ~1.0-255µm. Energy dispersive X-ray spectroscopic (EDS) analysis of the solid solutions confirm a predominance in the concentration of bismuth and zirconium while sodium, chlorine, and oxygen are present in minor concentration. The quantitative analytic results from EDS were used to determine Zr/Bi ratio.
Keywords
Nanomaterials; SEM-EDS; Accelerating voltage; Morphology; 3D-Images; Composition
Introduction
In the past decade, stabilized zirconias obtained via wet chemical routes have attracted much attention due to their unique physical, chemical, mechanical and thermal properties. Due to these favourable properties and the presence of acid-base centers, it is being used in a number of processes such as gas separation, micro and ultra filtration and support of catalytic converter in the petrochemical industry; and very recently as gate dielectrics [1, 2].
The influence of synthetic parameters such as type of precursor, pH during hydrolysis, doping with ions, and the technique used for its synthesis followed by post-thermal treatments on the structural, micro structural and electrical properties of stabilized zirconia has been extensively studied [2, 3]. Due to their hardness and corrosion resistance, several studies have been carried out in order to test different synthesis possibilities [4-7]. Furthermore, most studies performed on stabilized zirconias are targeted on the incorporation of rare-earth oxides into zirconia matrix via wet chemical routes in order to lower the activation temperature when used as electrolytes in Solid Oxide Fuel Cells (SOFCs) [8]. Since the physical and chemical stability of mixed oxides derived from wet chemical routes are of great interest, then it is very important to control the morphology and composition of the precursor used for the synthesis of stabilized zirconias.
Furthermore, phase distribution of stabilized zirconia and phase content has been determined using X-Ray Diffraction (XRD) technique [9]. Nevertheless, phase analysis via XRD technique is a rough method of quantification of composition. Recently, SEM-EDS system suitable for low accelerating voltage has been developed for morphology and chemical composition analysis of nanomaterials [10]. In addition to this, Field-Emission Scanning Electron Microscope (FE-SEM) has been utilised for spectral analysis of nanomaterials [11].
The purpose of this study is to investigate the correlation between the morphology and the composition of nanosized-stabilized zirconia using scanning electron microscope equipped with an Energy Dispersive Spectroscope.
Materials and Method
Solid solutions containing 8, 10,
12, 14, 16 mol% Bi2O3 stabilized ZrO2 are
synthesized by co-precipitation method. The samples are labelled 8BSZ-16BSZ to
correspond with the mol% of Bi2O3 in the ZrO2
matrix. Starting materials used for this synthesis are zirconium chloride octa-hydrate (ZrOCl2.8H2O, 99.5%
purity, BDH
Zirconylchloride and Bismuthoxychloride are dissolved in deionised water and warm dilute HCl respectively at room temperature, until a clear solution is obtained. The co precipitation of Bi2O3 and ZrO2 is obtained by mixing an appropriate concentration of dopant (Bi2O3) and matrix ZrO2 in a beaker, followed by neutralization with NaOH solutions and precipitation of the desired oxides specie:
![]()
The
sodium hydroxide/Zr4+ (Bi3+) mole ratio (R) conforms to
the requirement for achieving spherical nanosized-particles,
![]() [12].
[12].
The resulting acidic solid solutions, filtered using Whattman-12.5cm grade filter paper, are washed several times with deionised water and solutions of ammonia and propanol until the pH of the washing solution is 8.0. The co-precipitated powder dried at 200°C in air for 4h was subsequently calcined at 800°C for 4h to yield the nano-sized oxide particles. The calcination temperature was selected by taking into account the melting point of Bi2O3 i.e., 825°C. After cooling to ambient temperature, surface morphology and elemental composition of stabilized zirconia samples are analyzed with a scanning electron microscope (SEM) Leica- Cambridge, Stereoscan 440, equipped with an Energy Dispersive Spectroscope EDS, Oxford ISIS, microanalyser integrated. The accelerating voltage and the beam current used during sample analysis are 5.0kV and 1000.0pA respectively, at working distance of 25.0mm. The results are quantitatively analyzed using ZAF method with a normalization factor of 100.0.
Results and Discussions
Morphological Observation
Scanning electron microscopic images and the corresponding 3D surface maps of the stabilized zirconias are presented in Figures 1(a)-(e). The analyses revealed that the particles are non-spherical in shape and with little agglomeration and porosity. The surface topographies confirmed the presence of little agglomeration and porosity. For all of them, the zirconia appears agglomerated in light contrast and the bismuth oxide as dark background particles. The contrast observed in Figure 1(a)-(e) arises from two principal sources: first, the lightness of the zirconia phase compared with darker bismuth oxide background is mostly due to the difference in secondary electron yield of the two phases. Zirconia being less conducting has much the higher yield. The second cause of contrast is topographical, arising from the angular variations that the zirconia phase makes with the incident beam. Furthermore, the average particle sizes for the stabilized zirconia solid solutions are determined from SEM with imaging software (Image-J).
Figure 1(a) shows the microstructure of sample 8BSZ with two different phases appearing with little agglomeration while the 3D surface topography from the micrograph is shown alongside. The particles are nearly spherical in shape and the distribution of the particles is such that they are closely packed together giving rise to little porosity. The zirconia appears agglomerated in light contrast and the Bismuth oxide as dark background particles. The average particle size is determined from SEM with imaging software (Image-J) to be 101±4μm.
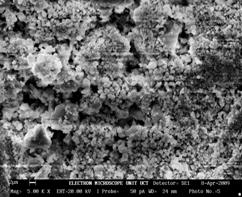
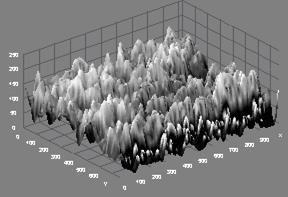
Figure 1(a). Microstructure and 3D Surface map for sample 8BSZ.
The microstructure of sample 10BSZ appears with two different phases with little agglomeration (Figure 1b) while the 3D topography of the surface obtained from the micrograph is shown alongside the microstructure. The particles are nearly spherical in shape and the distribution of the particles is such that they are closely packed together giving rise to little porosity. Hence, the zirconia appears agglomerated in light contrast and the Bismuth oxide as dark background particles. However, the average particle size is determined from SEM with imaging software (Image-J) to be 99±4μm.
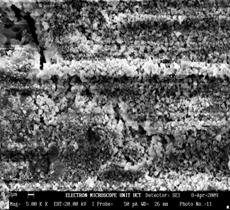
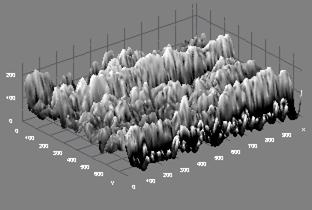
Figure 1(b). Microstructure and 3D Surface map for sample 10BSZ.
In Figure 1(c), the microstructure of Sample 12BSZ is displayed with two different phases while the 3D topography of the surface obtained from the micrograph is shown beside it. Just as in other two previous samples, the particles are nearly spherical in shape and the distribution of the particles is such that they are closely packed together giving rise to little porosity. Thus, the zirconia appears with little agglomeration in light contrast and the Bismuth oxide as dark background particles. In this case, the average particle size obtained from the particle size distribution analysis is 94±4μm.
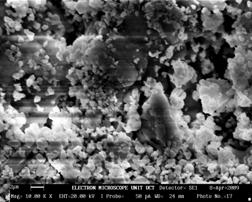
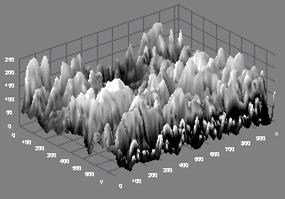
Figure 1(c). Microstructure and 3D Surface map for sample 12BSZ.
The microstructure for sample 14BSZ is shown in Figure 1(d) wherein the zirconia particles appear agglomerated in light contrast and the Bismuth oxide as dark background particles. The 3D topography of the surface obtained from the micrograph (beside the microstructure) shows that the distribution of the particles is such that they are closely packed together giving rise to little porosity. The particles are nearly spherical in shape and the average particle size obtained from the histogram of particle size distribution is 76±4μm.
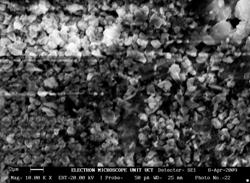
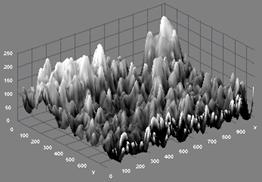
Figure 1(d). Microstructure and 3D Surface map for sample 14BSZ.
Finally, the microstructure for sample 16BSZ is quite different from the previous samples as evident from the much agglomeration of the particles even though there are two distinct phases representing Zirconia and Bismuth oxide (Figure 1e). The topography of the surface depicted alongside the microstructure shows close packing of the particles, with random distribution of light Zirconia particles over the agglomerated Bismuth oxide. The average particle size is determined from SEM with imaging software (Image-J) to be 88±4μm.
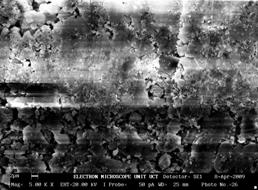
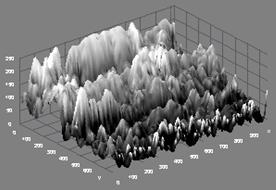
Figure 1(e). Microstructure and 3D Surface map for sample 16BSZ.
Chemical Composition Analysis
Results of Energy dispersive X-ray microanalysis for the different composition selected for this study is discussed herein. The X-ray spectra showing variation of characteristic X-ray intensity with energy are presented in Figures 2(a)-(e) and the corresponding tables showing the characteristic X-ray line and the percentage weight for various elements detected are presented in Table 1. The X-ray microanalysis confirmed the presence of Zirconium, Bismuth, Oxygen, Sodium and Chlorine as the components of the synthesized solid electrolytes. Zirconium and bismuth was detected with higher relative concentrations compared to the other components. The percentage weight ratios of Zirconium to Bismuth in all the synthesized solid electrolytes ranges from 6.4 to 15.4.
Table 1. Concentration of various Elements in the Stabilized Zirconia Solid Solutions
|
Sample |
Concentration of various elements |
||||
|
O-Kα |
Na-Kα |
Cl-Kα |
Zr-Lα |
Bi-Mα |
|
|
8BSZ |
1.22±0.03 |
1.54±0.03 |
1.64±0.15 |
89.28±0.34 |
5.80±0.19 |
|
10BSZ |
1.39±0.03 |
1.99±0.02 |
1.90±0.11 |
86.10±0.31 |
8.52±0.15 |
|
12BSZ |
1.35±0.03 |
1.57±0.03 |
1.76±0.13 |
85.30±0.32 |
9.50±0.15 |
|
14BSZ |
1.00±0.03 |
1.79±0.02 |
1.56±0.14 |
84.29±0.29 |
11.26±0.16 |
|
16BSZ |
1.26±0.04 |
1.88±0.02 |
1.68±0.19 |
82.40±0.32 |
12.89±0.18 |
Figure 2 (a)-(e) show the EDS spectra of the nanosized stabilized zirconia.

Figure 2(a). EDS Spectra for nanosized-stabilized zirconia 8BSZ.

Figure 2(b). EDS Spectra for nanosized-stabilized zirconia 10SZ.
In Table 1, the percentage weights for various elements detected are presented for sample 8BSZ with zirconium and bismuth having higher concentrations in the synthesized solid electrolyte. The percentage weights of zirconium and bismuth are in close agreement with the calculated volumetric concentrations where oxygen, sodium and chlorine are detected with lower concentrations as impurities in the synthesized solid electrolyte. The percentage weight ratio of zirconium to bismuth is determined approximately to be 15.4. Figure 2(a) depicts the EDS spectra for sample 8BSZ with the characteristic X-ray energies ranging from 0.15-1.31keV. The counting rate varies linearly with X-ray intensity up to rates of about 270-5,000 cps.
Results for Energy dispersive X-ray microanalysis obtained for sample 10BSZ is presented in Table 1 with higher concentrations of zirconium and bismuth in the synthesized solid electrolyte. The percentage weights of zirconium and bismuth agree closely with the calculated volumetric concentrations where sodium and chlorine are detected with lower concentrations as impurities in the synthesized solid electrolyte. The percentage weight ratio of zirconium to bismuth is determined approximately to be 10.11. Figure 2(b) displays the EDS spectra from sample 10BSZ with the characteristic X-ray energies ranging from 0.15-1.31keV. The counting rate varies linearly with X-ray intensity up to rates of about 270-5,000 cps.
Figure 2(c) shows the EDS spectra from sample 12BSZ with the characteristic X-ray energies ranging from 0.15-1.31keV. The counting rate varies linearly with X-ray intensity up to rates of about 270-5,000 cps. In Table 1 are weight percentages of the various elements detected in sample 12BSZ, the element with highest weight percentage is Zirconium followed by Bismuth. In comparison, oxygen, sodium and chlorine are of very low percentages. The percentage weights of zirconium and bismuth agree closely with the calculated volumetric concentrations. In this case, there is a decrease in percentage weight ratio of zirconium to bismuth with the value determined to be 8.98.

Figure 2(c). EDS Spectra for nanosized-stabilized zirconia 128BSZ.
Figure
2(d) shows the EDS spectra for sample 14BSZ with the characteristic X-ray
energies ranging from 0.15-1.31keV. It can be found that the peak intensity of the Zr L![]() is much stronger than the
peak intensity of Bi M
is much stronger than the
peak intensity of Bi M![]() . Qualitatively, the
peak intensity of Cl K
. Qualitatively, the
peak intensity of Cl K![]() decreases
with the increase of the Bi2O3 in the sample
14BSZ. The quantitative analytic results are shown in Table 1. For example,
the relative concentration of bismuth improved from 9.50 to 11.26% while
that chlorine depreciated from 1.76 to 1.56% and this decreasing trend is the
same for oxygen and sodium. The percentage weight ratio of zirconium to
bismuth is found approximately to be 7.5.
decreases
with the increase of the Bi2O3 in the sample
14BSZ. The quantitative analytic results are shown in Table 1. For example,
the relative concentration of bismuth improved from 9.50 to 11.26% while
that chlorine depreciated from 1.76 to 1.56% and this decreasing trend is the
same for oxygen and sodium. The percentage weight ratio of zirconium to
bismuth is found approximately to be 7.5.

Figure 2(d). EDS Spectra for nanosized-stabilized zirconia 14BSZ.
Figure 2(e) shows the EDS spectra from sample 16BSZ solid electrolyte discerned by the energy dispersive spectroscope EDS, Oxford ISIS, micro analyser. It can be seen that both the Zr and Bi elements were detected clearly. In addition, the existence of sodium and chlorine is due to sample contamination. Quantitatively, the relative concentration of oxygen improved from 1.00 to 1.26% while that for sodium decreased from 1.79 to 1.88% (Table 1). Just as in the previous sample relative concentrations of zirconium and bismuth are higher in the synthesized solid electrolyte. The percentage weight ratio of zirconium to bismuth is found approximately to be 6.4.

Figure 2(e). EDS Spectra for nanosized-stabilized zirconia 16BSZ.
Conclusions
The morphology and composition of the nanosized-stabilized zirconia have been observed using Scanning Electron Microscopy (SEM) coupled with Energy Dispersive X-ray Spectroscopy (EDS) at a low accelerating voltage of 5kV. SEM Images reveal the high three-dimensional (3D) anisotropy characteristics of the nanomaterials, distinctly. The lateral size changed from 1 µm to several tens micrometer or larger. The EDS microanalysis shows better energy resolution for the chemical composition analysis of the nanosized-stabilized zirconia. Energy dispersive X-ray spectroscopic (EDS) analysis of the solid solutions confirms a predominance of bismuth and zirconium while sodium, chlorine, and oxygen present in minor concentration. It is clearly seen that the peak intensity of the Zr-Lα is much stronger than the peak intensity of Bi-Mα for all the samples. Qualitatively, the peak intensities of Cl-Kα and Na-Kα are more enhanced compared with that of O-Kα, with shorter live time compared with that of Zr-Lα and Bi-Mα. Even with much shorter live time, the peak of O Kα in the nanosized-stabilized zirconia is also discerned clearly. The existence of Na and Cl is due to sample contamination.
Improvement on the quality of the nanosized-stabilized zirconia may be obtained using precursors containing nitrates and precipitating with NH4OH. The quantitative analytic results from EDS reveal Zr/Bi weight ratio to range from 6.4 to 15.4.
1. Radha A.V., Oscar B.M., SergeyV.U., Alexandra N., Pedro T., Surface Enthalpy, Enthalpy of Water Adsorption and Phase Stability in Nanocrystalline Monoclinic Zirconia. J. Am. Ceram. Soc., 2009, 92(1), p. 133-140.
2. Santos V., Zeni M., Bergmann C.P., Hohemberger J.M., Correlation Between Thermal Treatment and Tetragonal/Monoclinic Nanostructured Zirconia Powder Obtained By Sol-Gel Process, Rev. Adv. Mater. Sci., 2008, 17, p. 62-70.
3. Baudin C., Gurauskis J., Sanchez-Herencia A.J., Overa V.M., Identation Damage and Residual Stress Field in Alumina-Y2O3-stabilized Zirconia Composites, J. Am. Ceram. Soc., 2009, 92(1), p. 152-160.
4. Magnani G., Brilliante A. Effect of the composition and Sintering Process on Mechanical properties and Residual stress in Zirconia-Alumina Composites, J. Eur. Ceram. Soc., 2005, 25(15), p. 3383-3392.
5. Tuan W.H., Chen R.Z., Wang T.C., Cheng C.H., Kudo P.S., Mechanical Properties of Al2O3/ZrO2 Composite, J. Eur. Ceram. Soc., 2005, 22(16), p. 2827-2833.
6. Fortulan C.A., de Souza D.P.F., Microstructural Evolution of the Al2O3-ZrO2 Composites and its Correlation with Electrical Conductivity, Materials Research, 1999, 2(3), p. 205-210.
7. Casellas D.I., Rafolis L., Llanes L., Anglada M., Fracture Toughness of ZrO2-Al2O3 Composites, Int. J. Refrac. Met. Hard. Mater., 1999, 17(1-3), p. 11-20.
8. Shankar S.R., Jayakanth R., Maiti S., Kumar A., Manna I., Synthesis and Characterization of Nanocrystalline Dysprosia Stabilized Zirconia for Intermediate- Temperature Solid Oxide Fuel Cells, Material Science Eng. B, 2007, p. 1-14.
9. Dercz G., Prusik K., Pajak L. Structure Investigations of Commercial Zirconia Ceramic Powder, Journal of Achievements in Materials and Manufacturing Engineering, 2006, 18(1-2). p. 259-262.
10. Tanaka K., Odawara A., Nagata A., Ikeda M., Baba Y., Nakayama S.A., Microcalorimeter EDS system suitable for low acceleration voltage analysis,. Surf. Interface Anal., 2006, 38(12-13), p. 1646-1649.
11. Li Q.H., Ono Y., Homma Y., Tanaka K., Baba Y., Nakayama S., Fukuda K., Sasaki T., Nakai I., Spectral analysis of nanomaterials by a transition-edge sensor microcalorimeter mounted on a field-emission scanning electron microscope, Jpn. J. Appl. Phys., 2008, 47(6), p. 4835-4838.
12. Tok A.I.Y., Luo L.H., Boey F.Y.C., Woodhead J.L., Consolidation and Properties of Gd0.1Ce0.9O1.95 Nanoparticles for Solid Oxide Fuel Cell Electrolytes, J. Mater., 2006, 21(1), p. 119-124.