Design of a Novel System Based on 555 Timers to Automatically Sense Temperature, Force, Light, and Relative Humidity
Abdel W. BASIT*
Electronics Research Lab., Physics Department, Girls College for Art, Science and Education, Ain-Shams University, Heliopolis, Cairo, Egypt.
E-mail: wafaazekri2006@yahoo.com
*Corresponding Author: phone 002448083214; mob. 0201226045431
Abstract
The present paper was concerned with the design and application of a novel electronic system based on the well-known NE-555 timers. The proposed system was proved to be very useful for direct measurements of some commonly used physical quantities such as temperature, force, light, and relative humidity. The measured quantities were shown to be in the laboratory range, i.e., from -60°C up to 60°C, from 0 gm up to 300 gm; from 0 lux up to 13,000 lux; and from 21.0% up to 88.0%, respectively. Finally, theoretical and experimental results were shown to be in close agreement.
Keywords
Non-linear Resistances; NE-555 timer; Light intensity; Humidity; Temperature; Electrical devices; Frequency counter, and Astable multivibrators.
Introduction
Measurements of physical parameters, such as temperature, force, light, and relative humidity at high precision levels, are of great concern nowadays. In this concern, many trials were made to automatically, and preciously determine such physical quantities applying advanced electronic circuits and systems [1]. Resistive and capacitive (RC) sensors are the most commonly used sensors. Their applications span homeland security, industry, environment, space, traffic control, home automation, aviation, and medicine. More than 30% of modern sensors are direct or indirect applications of the RC sensing principles. The physical principles of resistive sensors are governed by several important laws and phenomena such as Ohms Law, Wiedemann-Franz law; photoconductive-, piezoresistive-, and thermoresistive - effects. The applications of these principles are presented through a variety of examples including accelerometers, flame detectors, pressure/flow rate sensors, RTDs, hygristors, chemiresistors, and bio-impedance sensors. Resistive sensors are used to monitor physical or chemical parameters that can induce a change in electrical resistance. The magnitude of the physical - or chemical - parameters, such as light, strain, voltage, magnetic field, or gas/liquid concentration, can be inferred from the measured resistance value [2, 3]. On the other hand, the sensors represent part of the interface media between the physical world and the world of electrical devices, such as computers. Sensors are used in everyday life, where they are widely used in automobiles, machines, aerospace, medicine, industry and robotics [1]. Finally, in monitoring, automation and control, small resistive changes can emulate the physical parameter of our interest such as force, displacement, vibration, and temperature [4, 5].
Conversion of resistive changes into corresponding time period or frequency changes has been presented since very long. Such conversions have been one of the most reliable and significant measurement steps in resistive transducers applications commonly used in todays industry [6]. Their applications are on the rise, particularly, in cases of automation and control being carried out wirelessly through small distances such as narrow gaps [4].
So, the present paper is a trial to shed further light on the application of a stable oscillators/frequency counter in conjunction with some well-known sensors (nonlinear resistors) Light Dependent Resistors (LDRs), Force Dependent Resistor (FDRs), Temperature Dependent Resistors (TDRs), and relative Humidity Dependent Resistors (HDR) for such monitoring techniques, depending on low-cost passive sensors. In addition, the paper presents a conditioning electronics designed to transform the output of low-cost resistive sensors to afrequency variable signal, rather than the need for a conditioning circuit that allows an interface to a microcontroller, taking advantage of the full range of the sensor and reducing the microcontroller requirements.
Material and Method
The circuit diagram of Fig. 1 is a basic astable multivibrator based on 555 IC timer circuit. The investigated system consists of selectable four sensing elements or resistors (LDR, FDR, TDR, and HDR), placed in a 555-timer circuit working in the astable mode. This forms the core of the measurement system. The circuit output, after further conditioning, is processed by a frequency counter system, which serves as the linearization element. The first section of the proposed system is characterized by its self-triggering and free running as multivibrator one [7]. On the other hand, the second section represents a linear-scale frequency meter circuit uses the same NE555 timer [8].
On the shown figure, the switch S can be easily connected with the proposed nonlinear sensitive sensor (Rsensor) to be used (either TDR, LDR, FDR, or RHDR). The external capacitor charges through Rsensor +RB and discharges through RB. Thus, the duty cycle of the multivibrator may be precisely set by the ratio of these two resistors
It is well known that the frequency or the repetition rate of the output pulses from 555 timer circuit in astable mode is determined by the values of the two resistors Rsensor and RB and by that of the timing capacitor C. The frequency is,
![]() (1)
(1)
The duration T1 of the HIGH level (ON time) and duration T2 of the LOW level (OFF time) of the pulse train, can be calculated as,
![]() (2)
(2)
and
![]() (3)
(3)
Thus, the total period is:
![]() (4)
(4)
The duty cycle is [9]:
![]() (5)
(5)
Also, the duty cycle (D) of the output waveforms is normally defined as the ratio of pulse duration when output high (W) to total pulse period (T) according to [10]:
![]() (6)
(6)
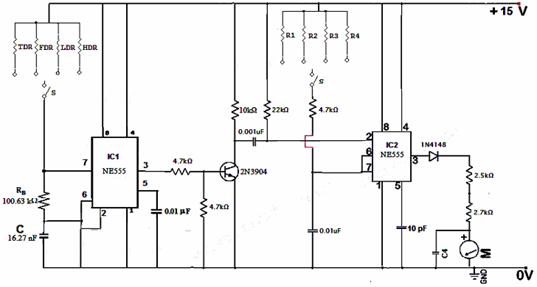
Figure 1. Astable Multivibrator / frequency Meter system
Types of Sensors Used
Temperature - Dependent Resistance
Temperaturedependent resistors (TDR) are commonly known as thermistors. They are a form of temperature-sensitive resistors (Fig. 2) formed using mixture of oxides of exotic metals. The dependence of the resistance on temperature can be approximated as [11-13]:
![]() (7)
(7)
where, RT and RR are device resistances at temperature T and rated temperature TR in K, respectively, and B is the material-specific constant of negative temperature coefficient of the thermistor.
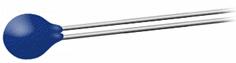
Figure 2. Discrete thermistor with insulated leads
Force - Dependent Resistance
The force-dependent resistance (FDR) or force sensitive resistor (FSR) is also another type of resistor which is composed of polymer thick film, which exhibits a decrease in resistance with any increase in force. Its force sensitivity is optimized for use in human touch control of electronic devices. It is basically two polymer sheets laminated together, one sheet is coated with interdigitating electrodes (Fig. 3) and the other is coded with interlinks proprietary semiconductive material. When force is applied to the FDR, the semiconductive material shunts the interdigitating electrodes to a greater or lesser degree [14, 15].
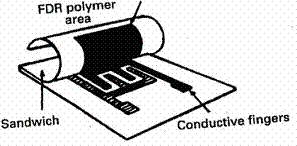
Figure 3. Force-dependent resistance
Light - Dependent Resistance
A photo resistor or light dependent resistor or cadmium sulphide (CdS) cell is a resistor whose resistance decreases with increasing incident light intensity [16].
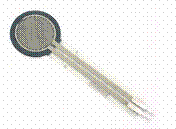
Figure 4. Light-dependent Resistance
Humidity - Dependent Resistance (Resistive Humidity Sensor)
Resistive humidity sensors measure the change in electrical impedance of a hygroscopic medium such as a conductive polymer, salt, or treated substrate. The specific resistivity of a hygroscopic material is strongly influenced by the concentration of absorbed water molecules. Its impedance change is typically an inverse exponential relationship to humidity. A typical hygristor (a contraction of hygro- and resistor) consists of a substrate and two silkscreen-printed conductive electrodes. The substrate surface is coated with a conductive polymer/ceramic binder mixture, and the sensor is installed in a plastic housing with a dust filter (Fig. 5) [17]. Humidity sensor is widely used in different application areas, especially in the industry requires the environment of humidity control, such as the semiconductor and LCD fabrication industries [18].
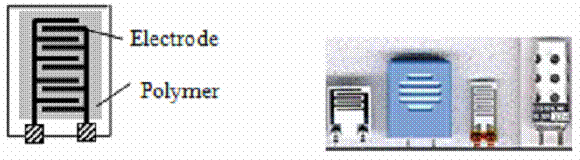
Figure 5. Resistive Humidity Sensors
The performance of the astable circuit/frequency Counter system has been verified using the non-linear resistances TDR, FDR, LDR, and HDR, respectively, connected to selector switch S. The output waveform of the first section was traced using Tektronix digitizing oscilloscope. On the other hand, the output current of the system can be traced applying 1mA ammeter (M). The meter was calibrated for full scale (1 mA), through the four resistors R1=105 kW or R2=112.45 kW or R3=191.5 kW or R4=101 kW, to measure full of ranges of temperature, force, light intensity or relative humidity, respectively. Finally, Table (1) illustrates the ranges of the physical parameters to be measured; i.e., temperature, force, light intensity, and relative humidity.
Table 1. Ranges of the investigated physical parameters
|
Variable |
Temperature, °C |
Force, gm |
Light Intensity, klux |
Relative Humidity, % |
|
Range, From To |
-60 - +60 |
0 - 300 |
0 - 13 |
20 - 88 |
Results
The characteristic curves of the investigated non-linear resistances (TDR, FDR, LDR and HDR) are shown in Fig (6).
|
|
b
|
|
c
|
d
|
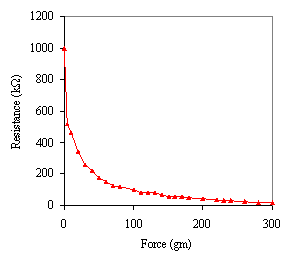
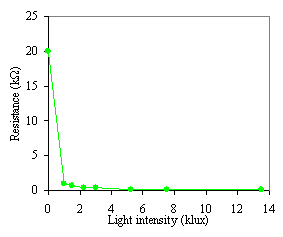
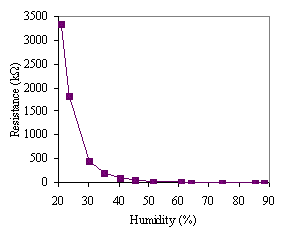
Figure 6. Transfer function of the (a) TDR, (b) FDR, (c) LDR and (d) HDR
Figure 7 shows the theoretical and experimental duty cycles calculated using Eqs. 5 and 6, and plotted versus (a) temperature, (b) force (c,) light intensity (d), and relative humidity (d).
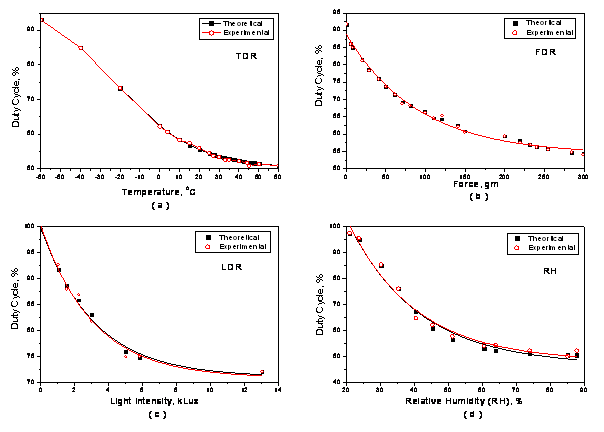
Figure 7. Theoretical and experimental duty cycles, plotted versus (a) temperature (b) force (c) light intensity and (d) relative humidity
The output waveforms frequency value, as a function of the different physical quantities (temperature, force, light and relative humidity), were traced applying Tektronix digital oscilloscope. As well, theoretical calculations were carried out, where data were plotted, and compared with experimental ones (Fig. 8).
Finally, and for simplicity, measurements of the frequency of the output waveforms, for the proposed physical quantities (temperature, force, light and relative humidity), were converted to be measured in terms of current passing through an ordinary ammeter (Fig.1). Finally, Fig. (9) shows the current amplitude of the output signal of the proposed system, plotted as a function of frequency for temperature, in °C (Fig. 9a), force, in gram (Fig. 9b), light, in lux (Fig. 9c), and relative humidity, in % (Fig. 9d).
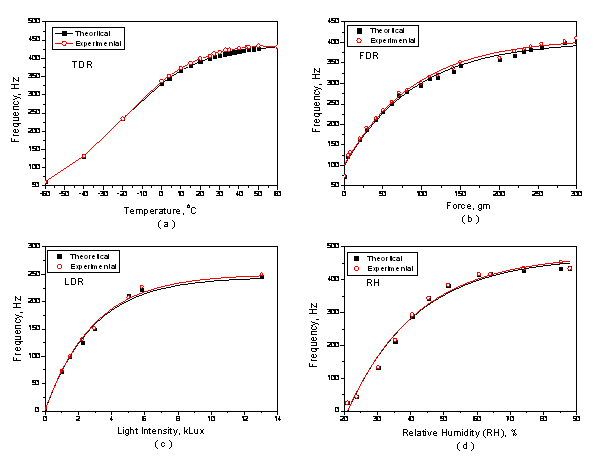
Figure 8. Theoretical and experimental output frequency plotted versus (a) temperature, (b) force (c), light Intensity, and (d) relative humidity

Figure 9. Output electric current plotted as a function of frequency for the proposed physical quantity applying frequency meter circuit
Discussion
Thermistors with initial high resistance values, of around 66 kW, were shown to be highly sensitive to temperature variations in the range from -60 °C up around 60 °C (Fig. 6a). Also, it is to be noticed that for higher temperature levels (above 20 °C), insignificant decrease in the device resistance is shown [19].
Considering the FDR, its force dependence is shown in Fig. (6b). A sample with initial resistance value of 1 MΩ, measured at no load, shows a pronounced decrease, down to 200 kΩ, whenever loaded with 50 gm. At a certain pressure, the contact area reaches its maximum and the transfer function goes to saturation [20].
For LDRs, when light strikes the conductive surface, its resistance
value decreases as a function of light intensity. Fig. (6c) is a graph of
resistance versus light intensity for a particular LDR. It is clearly shown
that LDRs are very sensitive to light intensity where samples with dark
resistance value of 20 kΩ exhibit reduced value of 160 Ω under the
light influence of around 13.5 klux [14]. Finally, Fig. (6d) shows the electrical
characteristics of the resistive humidity sensor versus the relative humidity
(RH) at 25 oC. The resistance changes from 3.3 M![]() down to 1.7 k
down to 1.7 k![]() due to the
changes on relative humidity level from 20% to 88%.
due to the
changes on relative humidity level from 20% to 88%.
Close agreements between both data sets were obtained (Figs. 7 and 8). Finally, Table (2) illustrates duty cycle values corresponding to the investigated physical quantities.
Table 2. Proposed physical quantity, sensor type, measuring range, and output waveform duty cycle
|
Physical Quantity |
Sensor |
Range; From To |
Duty Cycle, % |
|
Temperature, °C |
TDR |
-60 up to +60 |
93 down to 52 |
|
Force, gm |
FDR |
0 up to 300 |
92.5 down to 57.5 |
|
Light Intensity, klux |
LDR |
0 up to 13 |
100 down to 72.5 |
|
Relative Humidity, % |
HDR |
20 up to 88 |
97.5 down to 54 |
Thus, the ammeter dial could be considered as a good indicator of the relative frequency of the output signal (Fig. 9).
Conclusions
From the study, experimental work, theoretical calculations, and analysis, one can conclude that the proposed astable multivibrator / frequency counter system can be widely used in many applications. A new design of some simple resistive sensors (non-linear resistors) to frequency converter utilizing a astable circuit 555-timer is presented in this paper. So that, one can easily obtain an output in digital form. System evaluation was obtained in terms of its frequency response for the measured physical quantities (e.g., temperature, froce, light intensity and relative humidity). Finally, and for simplicity, the proposed system was provided with an ordinary ammeter where output waveform current amplitude could be measured in terms of the physical quantity after proper calibration.
References
1. Sharma M., Grover A., Bande P., Low Cost Sensors for General Applications, International Journal of Recent Trends in Engineering, 2009, 1(5), p. 150-152.
2. Du Y.W., Yelich W.S., Resistive and Capacitive Based Sensing Technologies, Sensors & Transducers Journal, 2008, 90, p. 100-116.
3. Suhling C.J., Jaeger C.R., Silicon Piezoresistive Stress Sensors and Their Application in Electronic Packaging, IEEE Sensors Journal, 2001, 1(1), p. 14-29.
4. Zeeshan S., Nadratul A.G., Noor Amalina R., Sumayyah D., Rumana T., Myo M.O., Sheroz K., Highly Sensitive Timer-Based Resistance Deviation To Time Converter, IIUM Engineering Journal, 2011, 12 (6), p. 33-43.
5. Revuelto J., Calvo B., Medrano N., Celma S., Zatorre G., A Circuit Interface for Resistive Sensors, Electron Devices, 2009, Spanish Conference, p. 316 319.
6. Xiujun Li., Gerard Meijer C.M., A Smart and Accurate Interface for Resistive Sensors, IEEE Transactions on Instrumentation and Measurement, 2001, 50(6), p. 1648-1651.
7. Forrest Mims M., The Forrest Mims Circuit Scrapbook, Volume II, LLH Technology Publishing, 2000.
8. Venura Electronics (online), Analog Frequency meter Circuit. Available at: http://www.electronicecircuits.com/electronic-circuits/analog-frequency-meter-circuit/.
9. Debangshu Dey, Sugata Munshi, Simulation Studies on a New Intelligent Scheme for Relative Humidity and Temperature Measurement Using Thermistors in 555 Timer Circuit, International Journal on Smart Sensing and Intelligent Systems, 2010, 3(2), p. 217-229.
10. Zbar P.A., Basic Electronics, A text-lab Manual, 5th Edition, USA, Mc Graw-Hill, inc, 1983.
11. Sinclair I.R., Sensors and Transducers, Third edition, Oxford, Newnes, 2001.
12. General Technical Information (online), NTC Thermistors. Available at: http://www.epcos.com/web/generator/Web/Sections/ProductCatalog/Sensors/TemperatureMeasurement/PDF/PDF__General__technical__information,property=Data__en.pdf;/PDF_General_technical_information.pdf (accessed February 2009).
13. Michalski L., Temperature measurement, 2nd edn, John Wiley & Sons, 2001.
14. El-Ghanam S.M., Ashry H.A., Swidan A.M., Soliman F.A.S., Morsi M., Design and application of an oscillator system converts temperature, light, force and gamma radiation to time, Journal of Active and Passive Electronic Devices, 2011, 6(1-2), p. 37-87.
15. Ambar R., Ahmad M.S., Abdul Jamil M.M., Design and Development of a Multi-sensor Monitoring Device for Arm Rehabilitation, International Journal of Integrated Engineering, 2011, 3(2), p. 55-62.
16. Saravanan C., Panneerselvam M.A., Christopher I.W., A Novel Low Cost Automatic Solar Tracking System, International Journal of Computer Applications, 2011, 31 (9), p. 62-67.
17. Winncy Du Y., Scott Yelich W., Resistive and Capacitive Based Sensing Technologies, Sensors & Transducers Journal, 2008, 90 (Special Issue), p. 100-116.
18. Yi T.-Y., Jie J.-H., Yi Liu C.-L., Yu H-W., A CMOS-MEMS Humidity Sensor, International Conference on Circuits, System and Simulation, IPCSIT volume 7, IACSIT Press, Singapore, 2011.
19. Volker H.H., High-Precision Measurement of Absolute Temperatures using Thermistors, Proc. Estonian Acad. Sci. Eng., 2007, 13(4), p. 379-383.
20. Freeman W.P., Lemen Cliff A., Measuring Bite Force in Small Mammals with A Piezo-Resistive Sensor, Journal of Mammalogy, 2008, 89(2), p. 513-517.