Correlation between Thermal Treatment and Phase Transformation in Nanocrystalline Stabilized Zirconia
Tajudeen Oladele AHMED1*, Patrick Ovie AKUSU1, Sunday Adesunloye JONAH2, and Nasiru RABIU1
1Department of Physics ABU,
E-mail(*): tajahmol@yahoo.co.uk, tajahmol@abu.edu.ng
*Corresponding author: Phone: +2348065650851; Fax:08123459676
Abstract
Stabilized zirconia produced via wet chemistry has chemically higher uniformity and purity. However, the grain size, particle shape, agglomerate size and specific surface area can be modified within certain degree by controlling the precipitation and sintering conditions. Generally, any physical or chemical difference between phases or effect occurring on the appearance or disappearance of a phase can be determined via thermal analysis and X-ray Diffractometry coupled with electron microscopy. In the last few decades, these materials have received tremendous attention globally in the field of defect solid-state devices. However, the challenge in this field of research has been to study thermal behaviour of these electrolytes during phase transformations and develop improved electrolytes with low activation temperature in the range of 600°C-800°C. In this paper, we report the wet chemistry of bismuth oxide stabilized zirconia having high experimental yield and low transformation temperature. Thus, the phase transformation from amorphous Zirconia to monoclinic is reported to begin above 600oC to an optimum temperature of 700oC. After calcination at 800oC for 4h, the powder have narrow particle size distribution in the range of 63-101µm. The average crystallite sizes of the synthesized powders range from 8-33nm.
Keywords
Stabilized zirconia; TGA-DSC; sintering-temperature; Phase transformation; XRD; SEM-EDS.
Introduction
Pure zirconia has a high melting point (2700°C) and a low ionic conductivity. However, when produced via wet chemistry by addition of monovalent-trivalent metal oxides such as CaO, MgO, Y2O3, La2O3, and Bi2O3 etc., the crystallization temperature is decreased and the powder produced have nanosize particles with improved ionic conductivity. As such, stabilized zirconias produced via such route are increasingly playing essential roles in defect solid-state devices from their use as electrolytes in solid oxide fuel cells (SOFCs), in oxygen sensors, super capacitors, as gas separation membranes, as gate dielectrics to hybrid solid electrolytes system for power generation [1]. However, a major problem thwarting the emergence of these devices is the high operating temperature associated with the commonly used yttria stabilized zirconia. The challenge in this field of research has been to develop alternative electrolytes to replace yttria-stabilized zirconia, in order to reduce the operating temperature from 1,000°C down to the range of 600°C-800°C. In an attempt to lower the operating temperature of YSZ, alternative electrolytes (e.g doped-CeO2 and certain perovskites such as the only recently discovered LaGaO3) with high oxygen ion conductivity have been investigated [2-6]. However, these novel materials have been found to be unstable under the prevailing reducing atmosphere at the anode side of SOFC.
Recent studies on dysprosia and scandia stabilized zirconias in this
temperature region by [7-9] have been successful, with achievement of much higher ionic conductivity when
zirconia was doped with
Materials and Method
Starting materials used
for this synthesis are zirconium chloride octa-hydrate (ZrOCl2.8H2O, 99.5% purity, BDH
![]()
The sodium hydroxide/Zr4+ (Bi3+) mole ratio (R) has significant influence on the precursor properties and the only achievable range for spherical nano-particles is 2.0< R ≤ 3.0.
The resulting solid solution was filtered using Whattman- 12.5cm filter paper and washed several times with distilled water and solutions of ammonia and propanol until the pH of the washing solution is 8.0. The co-precipitated powder was dried at 200°C in air for 4h. Thermal analyses (Differential Scanning Calorimetry-DSC and Thermo gravimetric Analysis-TGA) were carried out on the dried powders to determine optimal sintering parameters (time, temperature, atmosphere, etc). The DSC/TGA thermo-grams were recorded using an automatic micro thermal analyzer (Netzsch STA 449 Thermal analysis instrument) in air at a constant heating rate of 10°C per minute. The dried powder obtained was calcined in air at 800°C for 4 h to yield the nano-sized oxide particles. The sintering temperature was selected by taking into account the relatively low melting point of Bi2O3 i.e., 825°C. The crystal phase analysis of the calcined samples was carried out at room temperature with an X-ray Diffractometer Diffrac Bruker AXS, D8 Advanced Plus, at 30 mA and 35 kV, with monochromatic CuKα radiation, of wavelength λ= 1.5450Å. A scanned range 15-80° 2θ, with a step width of 0.02° were used. To obtain defined peaks it was necessary to use 15 sec as a count time per step and small grids, i.e. 0.2 mm. As this was only a phase identification method, no internal standard was added to the samples and phase identification with the ICDD-PDF database. The average crystallite sizes D of the synthesized powders were estimated using Debye Scherrer formula and lattice parameters were determined from Rietveld refinement as implemented in Crystal Sleuth software. Surface morphology of the samples were analyzed at room temperature under accelerating voltage of 20kV with a scanning electron microscope (SEM) Leica- Cambridge, Stereoscan 440.
Results and Discussion
Thermal Analysis
The combined DSC-TGA curves in Figs. 1 (a)-(c) represent the breakdown
behavior of the individual metal hydroxides. It can be seen that the
putrefaction of Zr(OH)4 takes place in two
stages (blue curves Figs. 1a-c). The endothermic peak at 130oC represents the loss of adsorbed moisture in the
co-precipitated powders. The peak at 210°C may
be assigned to the volatilization of ammonia and n-propanol used during
washing from the system. The subsequent endothermic
peak at 260°C and the broad endothermic peak
in the range 500°C-600°C correspond to the decomposition of Bi(OH)3 and Zr(OH)4 to their
amorphous oxide states respectively. This is accompanied by considerable
weight losses of 64.04%, 68.66% and 48.79% (black curves) which are
complemented by the associated exothermic peaks at 100°C and 250°C for samples
(a), (b) and (c). The onset of transformation into a stable monoclinic ZrO2 phase is observed above
600°C up to a saturation temperature of 700°C. This is evident from the powder
X-ray diffraction patterns for the samples and conforms to the work of
Figure 1(d) shows exothermic peaks at 100°C and 200°C while endothermic peaks at 130°C and 220°C. Following these transformations is a considerable weight loss of 46.28% due to evaporation of moisture content. Transformation into tetragonal phase of ZrO2 occurs above 600°C while the cubic Bi2O3 phase occurs above 700°C, but this is accompanied by a tetragonal Bi2O3 phase. This deduction is in accordance with the phase transformation of low symmetry phase of Bi2O3 to higher symmetry phase above 727°C, which on cooling leads to possible formation of tetragonal and body centered cubic phases. The overall weight loss of 71.83% was observed at saturation temperature.
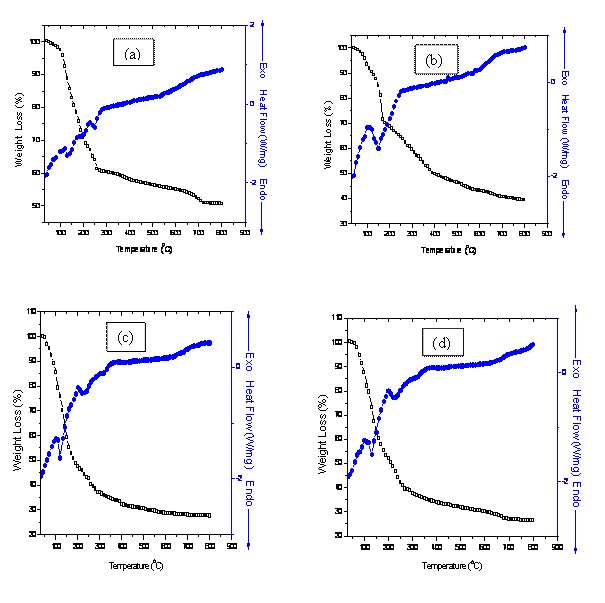
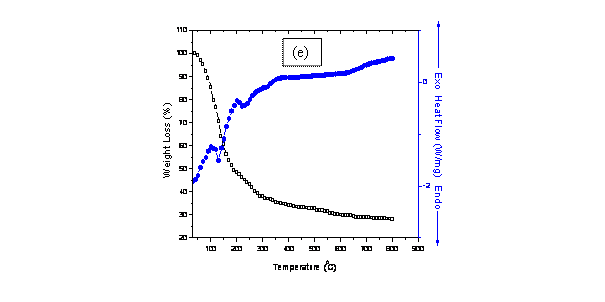
Figure 1. Combined DSC-TGA for samples (a) 8BSZ (b) 12BSZ (c) 18BSZ, (d) 40BSZ, and (e) 50BSZ
In fig. 1(e), the peaks at 100°C and 200°C are associated with exothermic transformations while those at 120°C and 220°C are associated with endothermic transformations (blue curve). The effect of these transformations corresponds to a weight loss of 45.89%. Phase transformations into monoclinic Bi2O3 and orthorhombic ZrO2 phases occur at 330°C while the cubic Bi2O3 phase occurs above 700°C. A constant weight loss above the transformation temperature up to a saturation point is followed by an overall weight loss of 72.46%.
The thermo-gravimetric analysis (TGA) of the co-precipitated powders is in agreement with the DSC peaks showing distinct regimes of weight loss corresponding to the temperature regions mentioned in the DSC. The TGA of the co-precipitated powders shows a weight loss of more than 50% and most of it occurs below 500°C with a slight weight loss continuing up to 700°C. This large weight loss could be because of the dehydroxylation of hydroxides, conversion of metal chlorides into oxides as well as removal of excess NaCl from the system. In the temperature range 700°C -800°C, there is no significant weight loss reflecting that the saturation temperature for the co-precipitated powders is 700°C. This deduction fits well with the results of elemental analysis and XRD analysis.
XRD Analyses
X-ray diffraction analyses of the co-precipitated powder samples were carried out and the patterns are given in Figs. 2(a)-(e). The intense peaks in the XRD patterns of the co-precipitated powder samples lie in the angular (2θ) range of 15° and 80°. The patterns were analysed and the peaks were identified using ICDD data file. It can be seen from the Figs. 2(a)-(c), that besides a very few minor peaks of bismuthoxychloride with low intensity, majority of the peaks belong to ZrO2, indicating that the lattice structure of the mixed oxide matrix is primarily of ZrO2 type. The XRD patterns of the co-precipitated powder samples in Fig. 2 (a) and (c) indicates that the intensity of the peaks (111) and (-111) is being modulated because of the presence of Bi2O3 in the ZrO2 unit cell. This shows that the some of the dopant atoms occupy similar positions as the host atoms thereby leading to the dopant adopting the structure of the host matrix. The cause of lower intensity of the dopant phase may be attributed to its lower proportion (mole fraction) in the the co-precipitated powder samples as compared to host matrix. X-ray diffraction patterns of the as-synthesized co-precipitated powders (Fig.2 a-c) showed sharply defined peaks of BiOCl (JCPDS File card no. 6-0249) indicating its presence in a significant amount. In particular there are no peaks for any compounds, including chlorides and hydroxides of zirconium and sodium found in the co-precipitated powders. The diffraction pattern indicates that all such compounds may be present in the powders in an amorphous form.
The co-precipitated powders calcined at 800°C for 4 h showed crystallization peaks of BiOCl (JCPDS File
card no. 6-0249) [14]. However, crystallization peaks of ZrO2 of monoclinic symmetry were observed for co-precipitated
powders calcined at 800oC for 4 h, and the
maximum peak in the diffraction pattern corresponded to the maximum peak
position of crystalline ZrO2 (ICDD File card no.
01-083-0937) [13]. The unit cell parameters for the monoclinic ZrO2 were obtained from Rietveld least square refinement to be ![]() Å,
Å, ![]() Å
and
Å
and ![]() Å for
co-precipitated powder sample (a),
Å for
co-precipitated powder sample (a), ![]() Å,
Å, ![]() Å
and
Å
and![]() Å for
co-precipitated powder sample (b) and
Å for
co-precipitated powder sample (b) and ![]() Å,
Å, ![]() Å
and
Å
and ![]() Å for
co-precipitated powder sample (c). The variation in the unit cell dimension is
due to unit cell expansion as a result of incorporation of dopant with
uncertainty in all cases less than 1%. The unit cell of BiOCl is
tetragonal and the XRD peak positions varied slightly for the co-precipitated powder samples corresponding to
variations in cell dimensions within the limits
Å for
co-precipitated powder sample (c). The variation in the unit cell dimension is
due to unit cell expansion as a result of incorporation of dopant with
uncertainty in all cases less than 1%. The unit cell of BiOCl is
tetragonal and the XRD peak positions varied slightly for the co-precipitated powder samples corresponding to
variations in cell dimensions within the limits![]() Å,
Å, ![]() Å and
Å and ![]() . The crystallite sizes of the co-precipitated powders were
calculated from the peak broadening of X-ray diffraction patterns using
Scherrer equation. The crystallite sizes were 29nm, 26nm and 21nm respectively
for the co-precipitated powders calcined at 800oC.
. The crystallite sizes of the co-precipitated powders were
calculated from the peak broadening of X-ray diffraction patterns using
Scherrer equation. The crystallite sizes were 29nm, 26nm and 21nm respectively
for the co-precipitated powders calcined at 800oC.
The XRD patterns for the as-synthesized co-precipitated powder samples containing higher concentration of dopant shown in Fig. 2 (d) and (e) are quite different from those shown in Fig 2(a)- (c). In the co-precipitated powders, there is ample amount of chloride; so amorphous Bi2O3 may have reacted with chloride to form the BiOCl phase as per the following equation:
|
|
(1) |
The presence of BiOCl peaks in XRD pattern (Fig. 2d) suggests that BiOCl is a very stable chloride in comparison with sodium chloride, and this may have delayed the formation of ZrO2 and Bi2O3 phases. The decrease in intensity of BiOCl peaks in the diffraction patterns indicates the gradual disappearance of that phase. This may have occurred as per the following reaction:
|
|
(2) |
Though the system takes oxygen from the
atmosphere, there is also a loss of 2 mol of chlorine for every mole of oxygen
coming into the system. This is well supported by a small and continued weight
loss at higher temperatures in the TGA curve. The unit cell parameters of
tetragonal ZrO2 were calculated to be ![]() Å,
Å, ![]() Å and
Å and ![]() while that for tetragonal BiOCl (
while that for tetragonal BiOCl (![]() Å,
Å, ![]() Å and
Å and ![]() ) [14]. The crystallite sizes were
8nm, 15nm and 33nm respectively for the different phases present in the
co-precipitated powders calcined at 800oC.
) [14]. The crystallite sizes were
8nm, 15nm and 33nm respectively for the different phases present in the
co-precipitated powders calcined at 800oC.
Finally, the XRD pattern for the co-precipitated powder sample shown in
Fig. 2(e) is very complicated. The presence of chlorine
in the system as BiOCl might have reacted with the amorphous Bi2O3 to form this phase.
However, crystallization peaks of Bi2O3 of monoclinic and tetragonal symmetries were observed for
co-precipitated powders calcined at 800oC for 4
h, and the maximum peak in the diffraction pattern corresponded to the maximum
peak position of crystalline tetragonal Bi2O3 (ICDD File card no. 01-076-2477) [13]. The presence of
BiOCl peaks in XRD pattern (Fig. 2e) suggests that bismuthoxychloride is a very
stable chloride in comparison with sodium chlorides, and this may have delayed
the formation of ZrO2 and Bi2O3 phases. The decrease in
intensity of chlorides of bismuth peaks in the diffraction patterns indicates the
gradual disappearance of that phase and this is in accordance with the above
equation (2) and the fact that the percentage weight of chlorine (11.41%) is
small compared with that in the co-precipitated sample (d). This is well
supported by the small percentage of chlorine in comparison with other samples
in the EDS analysis (Table 1).The unit cell parameters of orthorhombic ZrO2 were calculated to be ![]() Å,
Å, ![]() Å and
Å and ![]() Å while that
for tetragonal BiOCl is
Å while that
for tetragonal BiOCl is ![]() Å,
Å, ![]() Å and
Å and ![]() .
For the tetragonal Bi2O3 phase
.
For the tetragonal Bi2O3 phase ![]() Å and
Å and ![]() Å while that for the
monoclinic Bi2O3 phase is
Å while that for the
monoclinic Bi2O3 phase is ![]() Å,
Å, ![]() Å and
Å and ![]() Å. The
crystallite sizes were 9nm, 15nm, 12nm and 14nm respectively for the different
phases present in the co-precipitated powders calcined at 800oC.
Å. The
crystallite sizes were 9nm, 15nm, 12nm and 14nm respectively for the different
phases present in the co-precipitated powders calcined at 800oC.
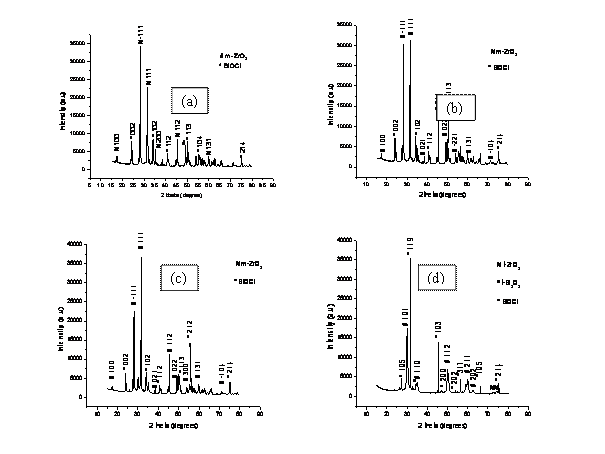

Figure 2. X-Ray Diffraction patterns for samples (a) 8BSZ, (b) 12BSZ, (c) 18BSZ, (d) 40BSZ, and (e) 50BSZ
Scanning Electron Microscopy and EDS Analyses
The microstructural investigations of the co precipitated powders in the system (ZrO2)1-x:(Bi2O3)x were carried out and the micrographs for the stabilized zirconia are presented in Fig. 3 (a)-(e) which shows that the grains are interspersed with the ZrO2 particles. The development of interfaces can also be predicted qualitatively from the micrograph (Fig. 3). However, the existence of ZrO2 as a separate phase was noticed as a common feature. The mixed oxide grains can also be contrasted as the Bi2O3 appearing as dark grain is overlaid by much clustered ZrO2 in lighter contrast. The contrast observed in the mixed oxide phase arises from two principal sources: first, the lightness of the zirconia phase compared with darker bismuth oxide background is mostly due to the difference in secondary electron yield of the two phases. Zirconia being less conducting has much the higher yield. The second cause of contrast is topographical, arising from the angular variations that the zirconia phase makes with the incident beam. In Figs. 3(a) and 3(b), the particles are nearly spherical in shape and the distribution of the particles is such that they are closely packed together. The average particle size is determined from SEM with imaging software (Image-J) to be 101±4μm and 94±4μm respectively. The microstructure in figure 3(c) shows clear boundary between the agglomerated grains of the mixed oxide phase with ZrO2 particles interspersed on the surface of the grains and along the grain boundaries. The average particle size is determined from SEM with imaging software (Image-J) to be 63±3μm. Even though the microstructure for co-precipitated samples in Figs. 3(d) and 3(e), appear distinct, the development of interfaces can also be predicted qualitatively from the micrographs. However, the existence of ZrO2 as a separate phase was noticed as a common feature but the mixed oxide phase appears much more agglomerated with plate like formation. Qualitatively, the ZrO2 phase is interspersed on the platy grains of the mixed oxide and along the interfaces. The average particle size is determined from SEM with imaging software (Image-J) to be 75±4μm and 67±2μm respectively. In conclusion, the morphology of the synthesized solid electrolytes revealed that the particles are nearly spherical in shape and with little agglomeration for samples shown Figs 3 (a)-(c) while for samples in Figs. 3(d) and (e) there is much more agglomeration leading to plate-like formation. The average particle size decreases with increase in volumetric concentration of dopant (Bi2O3) with a broad particle size distribution.
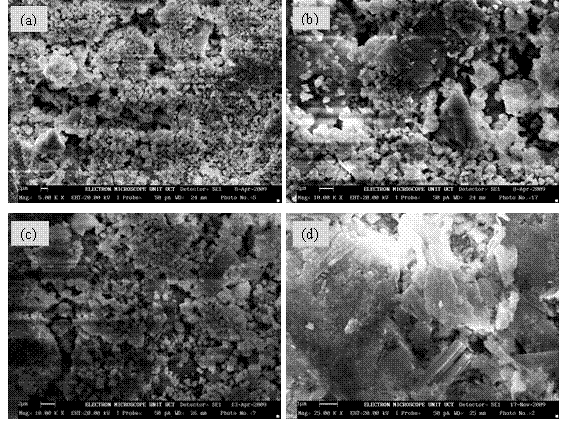
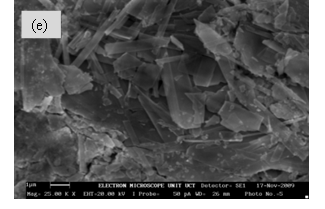
Figure 3. Typical Scanning Electron Micrograph (SEM) for Samples (a) 8BSZ, (b) 12BSZ, (c) 18BSZ, (d) 40BSZ, and (e) 50 BSZ
The X-ray microanalysis confirmed the presence of zirconium, bismuth, oxygen, sodium and chlorine as the components of the co-precipitated powder samples. Zirconium and bismuth were detected with higher relative concentrations compared to the other components. The quantitative analytic results for the co-precipitated powder samples are presented in Table 1.
Table 1. Sodium and Chlorine contents in the Stabilized Zirconia Solid solutions
|
Sample |
Sodium (%) |
Chlorine(%) |
|
a |
1.94 |
18.34 |
|
b |
6.10 |
18.01 |
|
c |
1.66 |
18.88 |
|
d |
- |
30.69 |
|
e |
- |
11.41 |
The chlorine content ranges from 11.41% to 30.69%. The chlorine content in the co-precipitated powders can be associated to the presence of NaCl, BiCl3, BiOCl and ZrCl4. Furthermore, the microanalysis of the co-precipitated powder sample (d) indicates 30.69% of Cl content, which may only be due to any chloride form of zirconium and bismuth as the chlorides of ammonium and sodium are not stable at high temperatures.
This suggests that the co-precipitated powder has a significant amount of entrapped unreacted chlorides of zirconium and bismuth during precipitation process. The same reason could also be extended to the entrapment of NaCl in the precipitates for co-precipitated powder samples (a)-(c) as chlorine content is significantly high. In contrast, the microanalysis of the co-precipitated powder samples (d) and (e) did not indicate the presence of sodium; this elimination may be due to excessive washing with doubly distilled water as it is easier to get rid of sodium compared to chlorine. The reduction in chlorine content in the co-precipitated powder sample (e) might be owed to the fact that greater percentage of bismuth chloride is converted to its oxide as compared to that of zirconium. The same logic could also be extended to the conversion of chloride of zirconium in preference to that of bismuth in the other co-precipitated powder samples.
Conclusion
The co-precipitated stabilized zirconia powders were synthesized via a wet chemical route with optimum sintering temperature of 700oC. The phase transformation form amorphous state to crystalline state for the stabilized zirconia occurred above 600°C for the monoclinic zirconia and above 700°C for the bismuthoxide. The X-Ray Diffraction analyses showed that BiOCl phase is a stable crystalline phase because the chloride of bismuth is more stable compared to the chloride of sodium. The average crystallite sizes for the phases contained in the stabilized zirconia powders spans the range of 8-33nm. The microstructure of the stabilized zirconia powders as obtained from SEM analysis revealed that the particles are nearly spherical in shape and had broad particle size distribution with little agglomeration and porosity. The particle size increases with increase volumetric concentration of dopant with values ranging from 63-101µm. Finally, EDS analysis confirmed the presence of Zirconium, bismuth, chlorine, sodium and oxygen as the components of the co precipitated powders with zirconium having higher concentration in all the samples except the sample (e) with 11.41% of chlorine and no traces of sodium.
References
1. Ahmed T. O., Akusu P. O., Jonah S. A., Rabiu N., Abdelmalik A. A., Zubairu S. M. J., Synthesis and Structural Evaluation of Nanocrystalline Bismuth Oxide Stabilized Zirconia for Intermediate-Temperature Solid Oxide Fuel Cells, Fifth International Conference of the African Materials Research Society, Sheraton Hotels, Abuja, Nigeria, 2009, p.140.
2. Georges S., Goutenoire F., Bohnke O. Steil M. C., Skinner S. J., The LAMOX Family of Oxide-Ion Conductors: Over-view and Recent Results, Journal of New Materials for Electro-Chemical Systems, 2004, 7, p. 51-57.
3. Srikant E., Bichile G. K., Synthesis and structural Characterization of (Bi2O3)1-x(Y2O3)x and (Bi2O3)1–x (Gd2O3)x solid solutions, Bull. Mater. Sci., 2004, 27(1), p.19-22.
4. Dudek M., Molenda J., Ceria-yttria-Based Solid Electrolytes for Intermediate Temperature Solid Oxide Fuel Cells, Materials Science-Poland, 2006, 24(1), p.45-52.
5. Tok A. I. Y., Luo L. H., Boey F. Y. C., Consolidation and Properties of Gd0.1Ce0.9O1.95 Nanoparticles for Solid Oxide Fuel Cell Electrolytes, J. Mater., 2006, 21(1), p. 119-124.
6. Zhong G. H., Wang J.
L., Zeng Z., Ionic Transport Properties in Doped ![]() Bi2O3, Journal of
Physics: Conference Series 29; 3rd Conference of the Asian Consortium for Computational
Materials Science, 2006, p. 106-109.
Bi2O3, Journal of
Physics: Conference Series 29; 3rd Conference of the Asian Consortium for Computational
Materials Science, 2006, p. 106-109.
7. Haering C., Roosen A., Schichl H., Degradation of the Electrical Conductivity in Stabilized Zirconia Systems: Part II: Scadia Stabilized Zirconia, Solid State Ionics, 2005, 176, p. 261-268.
8. Lei Z., Zhu Q., Low Temperature Processing of Dense Nanocrystalline Scandia doped Zirconia (ScSZ) Ceramics, Solid State Ionics, 2005, 176(37-38), p. 2791-2797.
9. Shankar S. R., Jayakanth R., Maiti S., Kumar A., Manna I., Synthesis and Characterization of Nanocrystalline Dysprosia Stabilized Zirconia for Intermediate-Temperature Solid Oxide Fuel Cells, Material Science Eng. B., 2007, p.1-14.
10. Zhu W. Z., Effect of Cubic Phase on the Kinetics of the Isothermal Tetragonal to Monoclinic Transformation in ZrO2(3mol%Y2O3) Ceramics, Ceramics International, 1998, 24, p. 35-43.
11. Santos V., Zeni M., Bergmann C. P., Hohemberger J. M., Correlation between Thermal Treatment and Tetragonal/Monoclinic Nanostructured Zirconia Powder Obtained By Sol-Gel Process, Rev. Adv. Mater. Sci., 2008, 17, p. 62-70.
12. Radha A. V., Oscar B. M., Sergey V. U., Alexandra N., Pedro T., Surface Enthalpy, Enthalpy of Water Adsorption and Phase Stability in Nanocrystalline Monoclinic Zirconia, J. Am. Ceram. Soc., 2009, 92(1), p. 133-140.
13. Ahmed T. O., Synthesis and Structural Evaluation of (ZrO2)1-x(Bi2O3)x Solid Electrolytes. Unpublished PhD Dissertation, Department of Physics, Ahmadu Bello University, Zaria, Nigeria, 2010, p. 1-184
14. Swansonr H. E., Fuyat K., Ugrinic G. M., Natl. Bur. Stand. (U.S.) Circ. No. 539, (JCPDS File Card. No. 6-0249), 1955, 4, p. 54.