Modeling,
Design and Simulation of Stand-Alone Photovoltaic Power Systems with
Abd Essalam BADOUD* and Mabrouk KHEMLICHE
Automatic laboratory of Setif, Electrical engineering department, university of Setif 1, Maabouda city, 19000 Algeria.
E-mail(s): badoudabde@yahoo.fr, mabroukkhemliche@yahoo.fr
* Corresponding author: Phone: +213 776 104 488; Fax: +213 36 92 51 02
Abstract
Stand alone
renewable energy based on photovoltaic systems accompanied with battery storage
system are beginning to play an important role over the world to supply power
to remote areas. The objective of the study reported in this paper is to
elaborate and design a bond graphs model for sizing stand-alone domestic solar
photovoltaic electricity systems and simulating the performance of the systems
in a tropical climate. The systems modelled consist of an array of PV modules,
a lead-acid battery, and a number of direct current appliances. This paper
proposes the combination of lead acid battery system with a typical stand alone
photovoltaic energy system under variable loads. The main activities of this
work purpose to establish library graphical models for each individual
component of standalone photovoltaic system. Control strategy has been
considered to achieve permanent power supply to the load via photovoltaic/battery
based on the power available from the sun. The complete model was simulated
under two testing including sunny and cloudy conditions. Simulation of the
system using Symbols software was performed and the results of simulation show
the superior stable control system and high efficiency. These results
have been contrasted with real measured data from a measurement campaign plant
carried on electrical engineering laboratory of
Keywords
Standalone System; Photovoltaic; Lead/acid battery; Modelling; Control; Bond Graph.
Introduction
Renewable energy sources (solar, wind, etc) are attracting more attention as alternative energy sources than conventional fossil fuel energy sources. This is not only due to the diminishing fuel sources, but also due to environmental pollution and global warming problems. Among these sources is the solar energy, which is the most promising, as the fabrication of less costly photovoltaic (PV) devices becomes a reality. With increased penetration of solar PV devices, various antipollution apparatus can be operated such as water purification through electrochemical processing and stopping desert expansion by PV water pumping with tree plantation. However, control problems arise due to large variances of PV output power under different insolation levels. Solar energy is attractive, because it directly converts solar radiation energy in to electricity. Its energy conversion and control system are simple and easy to maintain. Being inherently sustainable and eco-friendly, the PV based systems are gaining popularity [1, 2]. Photovoltaic applications can be broadly classified into two categories. One is the standalone system and other is the grid connected system. The standalone system is widely used in remote places where access to electricity is not viable. The standalone configuration can provide a well regulated load voltage but the reliability of power supply cannot be guaranteed [3]. Storage batteries are widely used to improve their liability of the standalone system [4]. The integration of PV system to the grid is rapidly increasing due to the improvement in the power electronics technology. Generally, single phase or three phase voltage source inverters (VSI) are used for interfacing PV system to grid and employs a controller to stabilize the DC bus voltage and regulate the current injected into the grid. Various topologies and control strategies for grid connected inverters have been reported in literature. The grid connected PV systems (GCPV), feeding active power to the grid can be controlled to supply there active power demand of the load [5].
The
continuous developments in the sector of photovoltaic applications have
rendered explicitly that the photovoltaic generators constitute a reliable
technological and economically viable investment choice. The privileged climate
of
In this paper, the PV model, battery model and the DC-AC inverter is implemented. A popular tow diode model of PV is used in this work. An equivalent circuit model structure for lead-acid batteries is used to facilitate the battery model part of the system model. Buck-Boost converter interface is used hence it is more suitable for battery charging. The purpose of the buck-boost converter is used to control the power flow from the PV panel to battery and load which requires MPPT control algorithm to find out the peak power of the PV panel. Bond graph algorithm is used for MPP tracking. The complete system is simulated using Symbols software.
Proposed System
Figure (1) show a stand-alone photovoltaic centralized system utilized to provide energy for residences sited at remote locations, far from grid distribution lines.
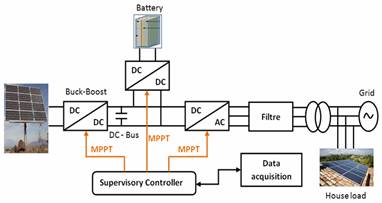
Figure 1. Proposed configuration
These systems are composed of a single array of photovoltaic panels, implemented in series and/or parallel connection depending on the power of the system. While using Buck-Boost DC/DC converters with bond graph MPPT for PV array to extract the maximum available power from them. The battery which is of Lead-Acid type is used to store the energy [6], to regulate the DC-Bus voltage through a reversible current DC/DC converter and to supply the load in the stand-alone case when low solar radiation conditions.
The energy produced for PV source is transferred from the DC-Bus to the house load through a DC/AC inverter controlled and filtered by an LC filter, while the excess power feeds the utility grid. Based on the data acquisition (Temperature, Irradiance, DC-Bus voltage…etc) the Supervisory Controller send the commands to the different converters in order to optimize and control the energy.
Models of the Panels
The modelling and simulation of photovoltaic system have made a great transition and form an important part of power generation in this present age. PV systems’ modelling however is quite complex. In literature, several computational methods are proposed by several researchers [7-10] for modelling the different components of stand-alone PV systems. Although some of these methods are impractical, complicated and require high computational effort, and some of these modelling was limited to simulation of photovoltaic module characteristics. Other methods are based on software simulation using readymade programs like PSpice, Matlab-Simulink and Labview [11-12].
Automatic data acquisition systems are currently used for both monitoring the system performance and control of its operation. The obtained information can be used to evaluate the plant efficiency during long periods and to optimize future systems in terms of performance and reliability. These systems are based on the use of micro-controller and microprocessor for PV applications [13]. Artificial intelligence techniques are becoming useful as alternate approaches to conventional techniques or as components of integrated systems. These methods used to model PV arrays, to estimate the maximum power point tracker and to predict the produced energy from the system [14]. Recently, interest was given to the modelling and simulation of the whole PV system based on bond graph [15].
Bond graph is an explicit graphical tool for capturing the structures among the physical systems and representing them as an energy network based on the exchange of power [16-17]. Others [18-20] have extended the bond graph concept to represent Phenomena such as chemical kinetics and to extract causal models and control structures from the bond graph networks. Bond graph, a graphical modelling language, provides a model formalism that decomposes the system into subsystems that map to the physical connections [21]. The resulting subsystems are essentially physical fields including mechanics, electronics, hydraulics, and chemistry. The time granularity for these domains is usually distinct.
A Photovoltaic (PV) system directly converts sunlight into electricity. The basic device of a PV system is the photovoltaic cell; they may be grouped to form panels or arrays [5,22]. This model is the most classical one found in the literature and involves: a current generator for modelling the incident luminous flux, two diodes for the cell polarization phenomena, and two resistors (Rs and Rsh) for the losses.
For the bond graph representation, the PV generator is then modeled by a flow source Sf = Iph in parallel with two resistors Rdiode and Rsh, the whole followed by a serial resistance Rs [8]. (Figure 2).
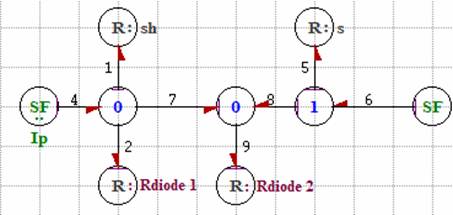
Figure 2. Bond graph model of PV with tow diodes
Buck-Boost DC/DC Converter
DC/DC converter performance optimization is important to accommodate the growing need for efficiency in portable electronic device battery life and an ever increasing world climate of energy maximization. The equivalent circuit of the converter is illustrated in figure (3).
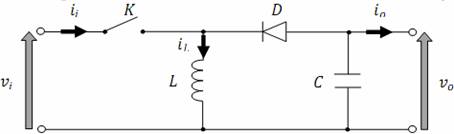
Figure 3. Equivalent circuit of a buck-boost converter
To ensure the charge and the discharge of the storage battery, the current must be reversible so that the energy transfer would be in the two directions, from the DC-Bus to the battery and vice versa. For that a Reversible current DC/DC converter is necessary, it's realized by associating a boost chopper and a buck one as shown in figure (4).
The bond graph model of converter DC/DC is thus given by the figure (5).
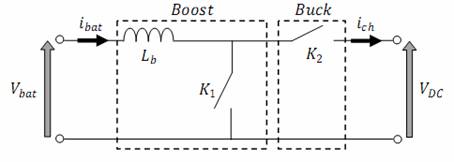
Figure 4. Equivalent circuit of a the reversible current DC/DC converter
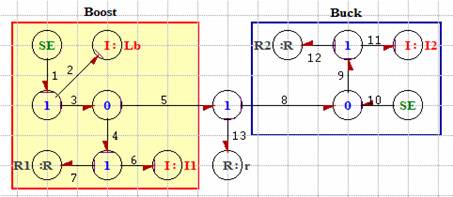
Figure 5. Bond graph model of boost-up chopper
Grid-Connected PV Inverter
Grid-Connected Inverter not only converts the direct current generated by photovoltaic cells into alternating current but also connects with the control of the frequency, voltage, current, phase, active and reactive power, etc [9]. So the control of grid connected inverter has always been the focus of the study and the research methods are varied. The topology of Grid-connected inverters is shown below (Figure (6)).
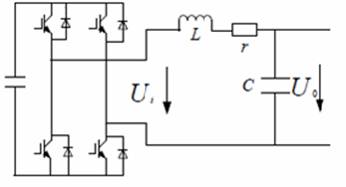
Figure 6. The structure of inverter (L = 0.47 mH; c = 20μF; r = 0.9Ω)
The transfer functions of inverter:
|
|
(1) |

After transformation:
|
|
(2) |
The bond graph model of the inverter with filter is given by figure (7).
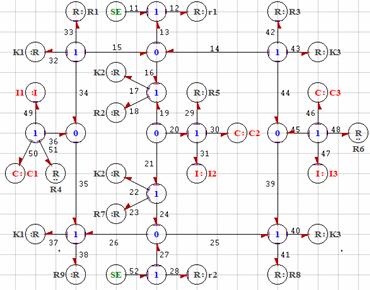
Figure 7. Bond Graph model of inverter with filter
MPPT in Stand-Alone PV Systems
In the
literatures, many MPPT techniques have been proposed to achieve the goal for
solar and wind energy conversion systems, including the voltage feedback method
(VFM), power feedback method (PFM), perturb and observe method (
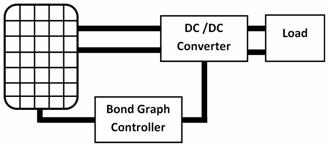
Figure 8. General Scheme for the proposed method
As shown in figure (8) the stand-alone PV system includes a solar array, DC/DC converter, resistive load and an MPPT control unit. The PV array converts solar energy to electric energy. In its V-P characteristic curve, there is a maximum point commonly called the maximum power point (MPP), at which the module operates with the maximum efficiency and produces the maximum power output Pmax. In order to obtain an operating point close to this MPP, a controlled DC/DC converter is usually employed to interface the energy flow from the solar module to the load.
The response time of the maximum PV power tracking due to a step irradiance input reflects the tracking speed of the MPPT method.
Energy Storage
There are
many different storage technologies that can be utilized with photovoltaic
systems. Research is currently being undertaken into the use of ultracapacitors as a means of energy storage for photovoltaic
systems.
In order to provide a complete charge for the battery an elaborated control strategy must be applied, such that the battery would be charged as fast as possible, within its operation limits, given that the daily generation period for the photovoltaic panels is limited. The batteries in a photovoltaic system operate in a cyclic way, discharging during the night and recharging during the day. The most recommended charging process in this case is the one with constant voltage and current limitation [17]. The bond graph model of the accumulator is shown in figure (9).
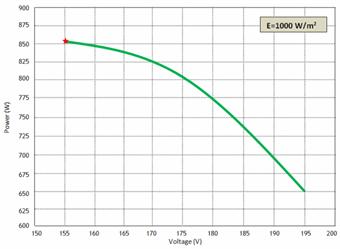
Figure 9. Variation of power according to the tension
Its structure is in conformity with the physical structure of the accumulator: the half-reactions to the anode and cathode are explicit on the left and on the right respectively. The electrolyte, a sulphuric acid diluted mainly dissociated in H+ ions and HSO4-, takes part here in the principal reaction. Very theoretical electrochemical component can be seen like a reversible transformer of chemical energy in electric power. We resorted to an element C multiport which makes it possible to represent a chemical energy transported during displacements of the species (flow) with the associated efforts.
The battery temperature enormously influences the behavior of the characteristic basic operation of the storage system and in particular on its storage capacity.
The following figure (10 and 11) shows that the increase in the temperature is accompanied by an increase moderated with that of the batteries storage capacity. Attention, this element C multiport does not store energy. This element "C multiport" also will enter the thermal energy exchanged with the environment.
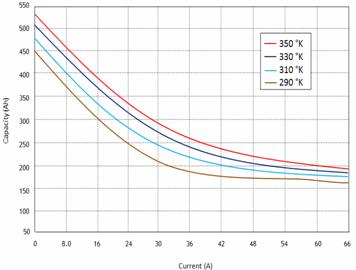
Figure 10. Influence temperature on the storage capacity
To study the influence of time, one seeks to approach with a close management in real time, state of the battery load, which in its turn is determining for the effective exploitation of the storage system.
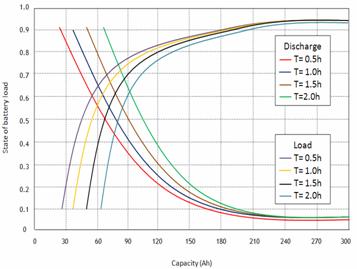
Figure 11. Influence time on the state of the battery
In the loading case, plus the duration of time increases, the batteries load state is below 1. In the case of the discharge, plus the time duration is significant. It is noted that the state of discharge reaches its maximum value for a long duration discharge.
Experimental Results
A prototype MPPT system (figure 12) has been developed using the described method and tested in the laboratory.
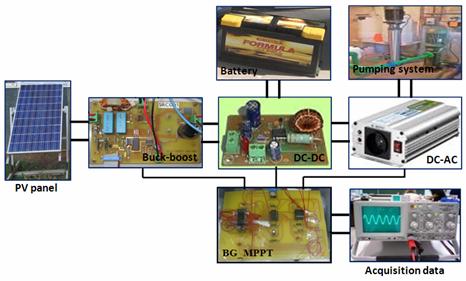
Figure 12. Material and methods test
The PV array gives a 150W maximum power, a 43.5V open-circuit voltage and a close-circuit current of 4.75A at a solar energy of 1 kW/m2 and a temperature of 25°C. The PV array was simulated with two solar energy cases, 65.36mA/cm2 (case A) and 24.98 mA/cm2 (case B) to test the proposed system under specific atmospheric conditions. Figure (13) and figure (14) plot the V-I and V-P curves under the two cases at 65°C.
The PV array gives a 150 W maximum power, a 43.5 V open-circuit voltage and a close-circuit current of 4.75 A at a solar energy of 1 kW/m2 and a temperature of 25 °C.
Figure (15) and figure (16) show the output voltage (CH1) and the current (CH2) wave forms. The solar energy is changed from A to B in Figure11. In Figure 15, the solar energy is changed from B to A. In the case A, the MPP is 27.3 V, 7.75 A and 102.648 W. And for the case B, the MPP is 32.28 V, 2.64 A and 42.61 W.
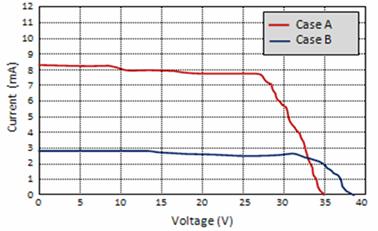
Figure 13. V-I curve under the case A and B at 65°C
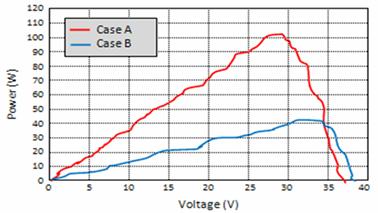
Figure 14. V-P curve under the case A and B at 65 °C
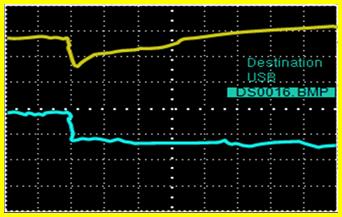
Figure 15. Output voltage and current of the PV array, the solar energy is changed from A to B (curve 1; 20 V/Div – 2.5 s/Div), (curve 2; 4 V/Div – 2.5 s/Div)
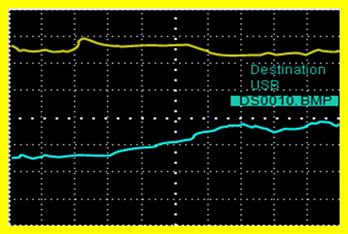
Figure 16. Output voltage and current of the PV array (the solar energy is changed from B to A) (curve 1; 20 V/Div – 2.5 s/Div), (curve 2; 4 V/Div – 2.5 s/Div)
The operation of bond graph algorithm has been evaluated by the experiments. Figure (17) shows the important characteristics of the experimental bond graph MPPT control , the output power is always less than 800 W without MPPT bond graph control (see figure 20.A) and the output power is always greater than 850 W with MPPT bond graph control (see figure 20.B).
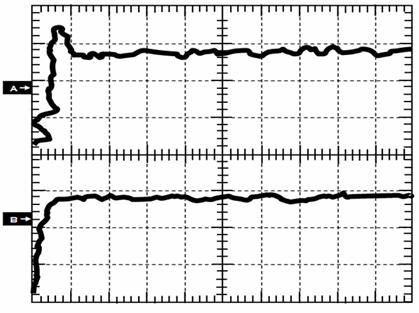
Figure 17. Output power (curve 1; 250 W/Div – 60 s/Div), (curve 2; 480 V/Div – 60 s/Div)
The maximum of the power 850 W at 155 V, the global efficiency (3 %) (Figure 18. A). For a different value of irradiation (1000 W/m2, 800 W/m2, 600 W/m2 and 400 W/m2), the optimal power rate is obtained for irradiance equal to 1000 W/m2 (850 W), corresponding to a global efficiency equal to 3 % (Figure 21. B).
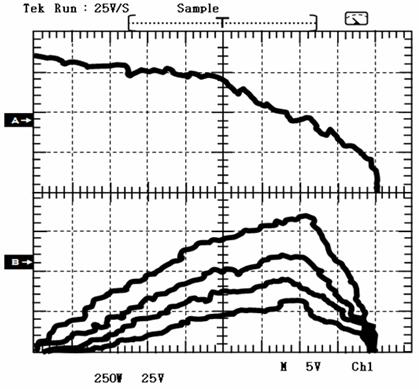
Figure 18. Variation of power according to the voltage (curve 1; 250 W/Div – 5 V/Div), PV power of MPPT method under step changing irradiance (curve 2; 250 W/Div – 25 V/Div)
As a result of the comparison between the experimental and the simulation and in order to confirm the established bond graph MPPT control and the obtained simulations, we belonged to experimental measurements of the power according to the tension and the PV power of MPPT method under step changing irradiance. The curves obtained are identical to simulations. We can conclude that there is a similarity and concordance.
Typical Annual Load Profile Definition
The typical annual load profile definition was also based on statistical analysis. In this statistical analysis a sample of 400 houses along with analytical data given by the Sonalgaz (Algerian society of electricity) were used and it was concluded that there are two peaks observed on the consumption of electricity in the domestic sector annually; one in summer, which is the highest, and one in winter. On the other hand, autumn and spring periods have more or less the same consumption of electricity which is lower compared to that of summer and winter. Also, another very important thing to notice is that the daily average electricity consumption of a house is around 24 kWh during summer, 21 kWh during winter and 15 kWh during autumn and spring.
To be more precise on the definition of the typical annual load profile this was split into weekdays and weekends for each of the four seasons. The months contained in each season are as follows; Winter: December, January and February; Spring: March, April and May; Summer: June, July and August; and Autumn: September, October and November. Additionally, it should be noted that holiday periods are not considered in the examined typical annual load profile. The typical load profiles for weekdays of spring, autumn and winter are shown in Figures 19, 20 and 21 respectively.
Figure 19. Load profile for a typical spring/autumn weekday
Figure 20. Load profile for a typical winter weekday
Figure 21. Load profile for a typical summer weekday
Simulation and Economic Analysis of Standalone PV System
After the proper setting up of the complete model for the standalone PV system a series of simulations were carried out in order to specify the required storage capacity and PV array power needed to cover the load over the time period of a typical year.
The results of the simulation process were recorded in a data file and subsequently processed to evaluate the load coverage achieved by each configuration. The most important results estimated during the simulation are presented in Table 1.
Table 1. Results of the simulation process for the standalone PV system
|
N° |
N° of PV |
PV power (kW) |
N° of batteries |
|
Annual energy deficiency (kWh) |
Annual period of energy deficiency (h) |
|
1 |
35 |
7.6 |
32 |
120 |
525 |
625 |
|
2 |
45 |
8.6 |
32 |
120 |
207 |
203 |
|
3 |
55 |
11.3 |
32 |
120 |
18 |
21 |
|
4 |
60 |
11.7 |
32 |
120 |
06 |
01 |
|
5 |
58 |
11.1 |
32 |
130 |
0 |
0 |
From the results of Table 1 it can be seen that the systems that achieve 100% annual load coverage over a typical year are those of Configurations 4 and 5. Additionally, it is observed that the system of Configuration 3 is rather acceptable since it has a very low energy deficiency of 18 kWh or 21 hrs per year. It should be noted that two different approaches are considered for these systems with the difference between them being that configuration 5 has larger energy storage capacity and lower PV array power (smaller size) while Configuration 4 have larger PV array power (larger size) and lower energy storage capacity. This is a very important fact to consider when deciding which is the optimum configuration for the system to be designed. To do so, Configurations 5, 6 and 12 are evaluated in terms of economic viability for a total system life of 25 years.
Conclusions
This work introduced a new stand-alone photovoltaic system topology, based on decentralized structures, which employ a DC-DC converter dedicated to a reduced number of photovoltaic panels, allowing the photovoltaic panels to take full advantage of the energy generated by the photovoltaic panels, which could deliver to the DC bus up to 16% more energy, when compared to centralized systems.
The bond graph tool in multi-field matter seems the best tool adapted to this spot; in addition to its use for the structural analysis and simulation. The found results proved to be interesting because they found curves reveal a similarity between the found results and the results expected (real) in the specifications. The design and simulation of a based MPPT controller was proposed. Compared to the system without MPPT in previous work, the proposed BG-MPPT has improved the transitional state and reduced the fluctuations in the steady state. It has characterized by relatively higher efficacy to those of other algorithms.
The experimental results are quite satisfactory, showing the effectiveness of the bond graph control proposed in improving the power quality and the reliability of the power supply.
Reference
1. Gabler H., Autonomous power supply with photovoltaics: photovoltaics for rural electrification reality and vision, Renewable Energy, 1998, 15, p. 512-518.
2. Lalouni S., Rekioua D., Rekioua T., Matagne E., Fuzzy logic control of stand-alone photovoltaic system with battery storage, J Power Sources 2009, 193, 899-907.
3. Chiang H. C., Ma T. T., Cheng Y. H., Chang J. M., Chang W.N., Design and implementation of a hybrid regenerative power system combining grid-tie and uninterruptible power supply functions, IET Renew Power Gener, 2010, 4(1), p. 85-99.
4. Li C.-H., Zhu X.-J., Cao G.-Y., Sui S., Hu M.-R., Dynamic modeling and sizing optimization of stand-alone photovoltaic power systems using hybrid energy storage technology, Renewable Energy, 2009, 34, p. 815-826.
5.
Villalva M. G., Gazoli
J. R., Filho E. R., Comprehensive Approach to Modeling and Simulation of Photovoltaic Arrays,
6.
Ceraolo M., New Dynamical Models of
Lead-Acid Batteries,
7. Coupti J. B., Lorenzo E., Chenlo F., A general battery model for PV system simulation, Progress in Photovoltaic: Research and Application, 1993, 1, p. 283-92.
8. Gow J. A., Manning C. D., Development of a photovoltaic array model for use in power-electronics simulation studies, IEE Proceedings-Electric Power Applications 1999, 146(2), p. 193-200.
9. Zhou W., Yang H., Fang Z., A novel model for photovoltaic array performance prediction, Applied Energy, 2007, 84(11), p. 87-98.
10. Ross J. N., Markvart T., He W., Modelling battery-charge regulation for a stand-alone photovoltaic system, Solar Energy, 2000, 69, p. 181-190.
11. Hansen A. D., Sorensen P., Hansen L. H., Binder H., Model for stand-alone PV system, Roskilde: Rio National Laboratory, 2000.
12. Castaner L., Silvestre S., Modelling photovoltaic using PSpice, John Willy & Sons, LTD, 2002.
13. Koutroulis E., Kalaitzakis K., Development of an integrated data-acquisition system for renewable energy systems monitoring, Renewable Energy, 2003, 28, p. 139-152.
14. Mellit A., Benghanem M., Kalogirou S. A., Modelling and simulation of a stand-alone photovoltaic system using an adaptive artificial neural network, Renewable Energy, 2007, 32, p. 285-313.
15. Zitouni N., Andoulsi R., Sellami A., Mami A., Hssen A., A new Bond Graph Model of a Water Disinfection System Based on UV Lamp Feed by Photovoltaic Source: Simulation and Experimental Results. J. Automation & Systems Engineering, 2011, 5(2), p. 79-95.
16. Umesh Rai B., Umanand L., Bond graph toolbox for handling complex variable, Control Theory & Applications 2009, 3(5), p. 551-560.
17.
Paynter H. M., Analysis and design of
engineering systems,
18.
Bouamama B., Busson
F., Dauphin-Tanguy G., Staroswiecki
M., Analysis of structural properties of thermodynamic bond graph models.
In Proceeding of the 4th IFAC : Fault
Detection Supervision and Safety for Technical Processes, vol. 2 IFAC,
19. Dauphin-Tanguy G., Rahmani A., Sueur C., Bond graph aided design of Controlled systems, Simulation Practice and Theory, 1999, 7, p. 493-513.
20. Gawthrop P., Bevan G., Bond graph modeling - A tutorial introdution for Control engineers, IEEE Control System Magazine, 2007, 27(2), p. 24-45.
21.
Karnopp D., Rosenberg R., Analysis and
simulation of multiport systems: The Bond graph
approach to physical system dynamics,
22. Alberteanu I. L., Ivanov S., Manolea G., Modeling and simulation of stand/alone photovoltaic system, 8th WSEAS Conference on Power Systems, 2008, p. 189-194.
23.
Badoud A., Khemliche
M., Grid-Connected modeling, Control and
Simulation of Single-hase two-Level Photovoltaic Power
Generation System Coupled to a Permanent Magnet Synchronous Motor,
24. Bialasiewicz J. T., Renewable energy systems with photovoltaic power generators: operation and modeling, IEEE Trans Indus Electron, 2008; 55(7), p. 2752-2758.
25. Bo Yang, Wuhua Li, Yi Zhao, Xiangning He, Design and Analysis of a Grid-Connected Photovoltaic Power System, IEEE transactions on power electronics, 2010, 25(4), p. 992-1000.
26.
Hussein K. H., Muta
27. Kuo Y.-C., Liang T.-J., Chen J.-F., Novel maximum power point tracking controller for photovoltaic energy conversion system, IEEE Trans Indus Electron 2001, 48(3), p. 594-601.
28. Chang T.-P., Output energy of a photovoltaic module mounted on a single axis tracking system, Appl. Energy, 2009, 86, p. 2071-2078.
29.
30. Otieno C. A, Nyakoe G. N., Wekesa C. W., A neural fuzzy based maximum power point tracker for a photovoltaic system, In: 2009 IEEE AFRICON, Nairobi, Kenya, September 23-25, 2009.
31. Veerachary Mummadi, Senjyu Tomonobu, Uezato Katsumi, Feed forward maximum power point tracking of PV systems using fuzzy controller, IEEE Trans Aerospace Electron System 2002, 38(3), p. 969-981.
32. Veerachary Mummadi, Senjyu Tomonobu, Uezato Katsumi, Neural-network based maximum power point tracking of coupled inductor interleaved boost converter supplied PV system using fuzzy controller, IEEE Trans Indus Electron 2003, 50(4), p. 749-758.
33. Buller S., Thele M., Karden E., Rik W. De Doncker, Impedance-based non-linear dynamic battery modeling for automotive applications, Journal of Power Sources, 2003, 113, p.422-430.