Mathematical Model for Photovoltaic Cells
Wafaa ABD EL-BASIT1*, Ashraf Mosleh ABD ElMAKSOOD2 and
Fouad Abd El-Moniem Saad SOLIMAN2
1Electronics Research Laboratory, Physics Department, Faculty of Women for Arts, Science and Education, Ain-Shams University, Heliopolis, Cairo, Egypt.
2Nuclear Materials Authority, P. O. Box 530, Maadi-11728, Cairo, Egypt.
E-mails: wafaazekri@gmail.com (*); ashraf.mosleh@yahoo.com; fouad.saad.soliman@gmail.com
*Corresponding Author: phone 002448083214; mob. 0201226045431
Abstract
The study of photovoltaic systems in an efficient manner requires a precise knowledge of the (I-V) and (P-V) characteristic curves of photovoltaic modules. So, the aim of the present paper is to estimate such characteristics based on different operating conditions. In this concern, a simple one diode mathematical model was implemented using MATLAB script. The output characteristics of PV cell depend on the environmental conditions. For any solar cell, the model parameters are function of the irradiance and the temperature values of the site where the panel is placed. In this paper, the numerical values of the equivalent circuit parameters are generated by the program. As well, the dependence of the cells electrical parameters are analyzed under the influence of different irradiance and temperature levels. The variation of slopes of the (IV) curves of a cell at short-circuit and open-circuit conditions with intensity of illumination in small span of intensity and different temperature levels have been applied to determine the cell parameters, shunt resistance, series resistance. The results show that the efficiency of solar cells has an inverse relationship with temperature, irradiance levels are affected by the change of the photo-generation current and the series resistance in the single diode model.
Keywords
Photovoltaic cell; Output electrical characteristics; Irradiance; Temperature; Modeling, Matlab.
Introduction
Developing alternative energy resources with high efficiency and low emission has become of great importance with increasing concerns about fossil fuel deficit, high oil prices, global warming, and damage to environment and ecosystem [1]. In this concern, photovoltaic solar energy is a clean, renewable, energy with a long service life and high reliability [2]. A photovoltaic system converts sunlight into electricity, where, the basic device of a photovoltaic system is the photovoltaic cell. Cells may be grouped to form panels or modules [3]. The modeling and simulation of photovoltaic (PV) have made a great transition and form an important part of power generation in this present age. The modeling of PV module generally involves the approximation of the non-linear (I-V) curves. Many researchers used circuit based approach to characterize the PV module of which the simplest model is the current source in parallel to a diode [4, 5]. Finally, the main objective of present paper is to shed further light on the modeling techniques applied for photovoltaic cells characterizations and investigating the effects of the cells physical parameters (series - and shunt resistances), as well, the environmental ones (temperature - and irradiance -levels).
Material and Method
Circuits Model for Photovoltaic Cell
Ideal Photovoltaic Model
An ideal Photovoltaic cell consists of a single diode connected in parallel with a light generated current source, Iph (Fig. 1a), where, its output current, I, can be written as:
|
|
(1) |

where: Is = cell saturation of dark current, VT = thermal voltage = kTc/q, k = Boltzmann's constant, = 1.38 ∙ 10−23 J/K, Tc = cells working temperature, q = electron charge (1.6 ∙ 10−19 C), n = ideality factor equal to 1.1.
Non-Ideal Photovoltaic Models
Photovoltaic Model with Series Resistance
The photovoltaic model with series resistance (Rs-model) depicted in Fig. (1b) is achieved with inclusion of series resistance Rs, hence, the output current can be derived as:
|
|
(2) |

Photovoltaic Model with Series and Parallel Resistances
Equation (2) does not adequately represent the behaviour of the cell when subjected to environmental variations, especially at low voltages. A more practical model can be seen in Fig. (1c), where series Rs, and parallel resistances Rsh, are introduced [6]. Series resistance is very small, which arises from the ohmic contact between metal and semiconductor internal resistance. But shunt resistance is very large and represents the surface quality along the periphery, noting that in ideal case Rs is 0 and Rsh is ∞ [7]. Applying Kirchhoffs law to the node where Iph, diode, Rsh and Rs meet, and one get [8-10]:
|
|
(3) |
|
|
(4) |

where: Id = diode current, Ish = shunt current, and G = solar insolation.
This model yields more accurate results than the Rs model, but at the expense of longer computational time. A modification of this model was proposed by several authors by adding an extra diode. This additional diode represents the recombination effects of the charge carriers. In general, the two diode model is more accurate but the computational time is much longer [6]. For simplicity, the single diode model of Fig. (1c) was used throughout the present work.
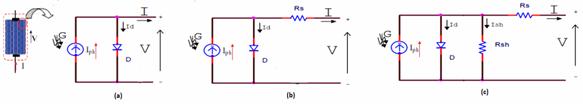
Figure 1. Circuits model for PV cell (a) Ideal, (b) with series resistance, Rs,
(c) with series and parallel resistance, Rs and Rsh.
The photocurrent mainly depends on the solar insolation and cells working temperature, which is described as [11, 12]:
|
|
(5) |
where: Isc = solar cell short-circuit current; Gref = reference solar insolation in W/m2 ; Tref = cells reference temperature, KI = cells short-circuit current temperature coefficient, and G = solar insolation in W/m2.
On the other hand, the cells saturation current varies with the cell temperature, which is described as:
|
|
(6) |

where : IRS = cells reverse saturation current at a reference temperature and a solar radiation, Eg = band-gap energy of the Si solar cell, = 1.10 eV, and n = is dependent on PV technology.
The reverse saturation current at reference temperature can be approximately obtained as:
|
|
(7) |

The Voc parameter is obtained by assuming the output current is zero [13].
An important characteristic of solar panels is its Fill Factor (FF). The factor which represents how square the voltage/current characteristic of a panel is. In general, PV panels usually have an FF somewhere between 0.4 and 0.8; ideal PV panels have a Fill Factor of 1.0. The Fill Factor (FF) is the ratio of the maximum power point divided by Voc and Isc [14].
|
|
(8) |

The reduction in Fill Factor (FF) corresponding to the total series resistance is given by:
|
|
(9) |
where, FFideal = ideal Fill Factor equal to 0.824 [15].
Based on mathematical equations of the photovoltaic cells, a model was written for Matlab software package applications. A function in Matlab has been developed which calculates the current module from data of voltage, solar radiation and temperature. From which, the (I-V) and (P-V), as well as, maximum power point could be obtained [16]. Noting that for the case of study, Isc = 1.9 A, Gref = 1000 W/m2, Tref =300 K, KI = 0.0017, Rs = 0.01 Ω and Rsh = 300 Ω are assumed to be known.
Results
Illumination Effects
(I-V) - and (P-V) - Characteristic Curves
The dependence of the (I-V) and (P-V) characteristic curves of PV cells on illumination level, plotted at temperature of 25 °C, were shown in Figs. (2, 3).
Figure 2. (I-V) Characteristic curves of solar panel, plotted at different irradiance levels and 25°C.
Figure 3. (P-V) Characteristic curves of solar panel, plotted at different irradiance levels and 25 °C.
Dependence of the Solar Cell Electrical Parameters on Illumination Level
During operation, the efficiency of solar cells is reduced by the dissipation of power across internal resistances. These parasitic resistances can be modeled as a parallel shunt resistance (Rsh) and series resistance (Rs), as depicted in Fig.(1c). It is possible to approximate the Rs and Rsh, from the slopes of the (I-V) curves at Voc and Isc, respectively. Typically, Rs and Rsh of solar cell at Voc and at Isc have been plotted against intensity of illumination at room temperature in Fig. (4). The dependence of the electrical parameters of the solar cells (Isc, Voc, Pmax, and FF) on illumination level, plotted at 25°C, was shown in Fig. (5).
Figure 4. Dependence of the parasitic resistances of solar cell on illumination levels, plotted at 25°C.
Figure 5. Dependence of the solar cell electrical parameters on illumination levels, plotted at 25 °C.
Temperature Effects
(I-V) -And (P-V) -Characteristic Curves
In general, for a given illumination level (1000 W/m2), when the cell temperature increases, the open circuit voltage Voc, drops dramatically, while the short circuit current increases slightly (Fig. 6). On the other hand, concerning the output power of the proposed solar cells, the (P-V) characteristic curves were plotted at different temperature levels, ranging from 0°C up to 100°C, keeping the solar irradiance constant level at 1000 W/m2 (Fig. 7).
The characterization of Rs and Rsh on its temperature dependence was carried out. The dependence of Rs and Rsh on temperature, for silicon solar cells, plotted at 1000 W/cm2, was shown in Fig. (8).
The temperature dependence of the principal cell parameters such as, Isc, Voc, Pmax and FF were plotted in Fig. (9) for a silicon solar cell.
Figure 6. (I-V) curves of solar cell plotted at different temperature levels and 1000 W/m2.
Figure 7. (P-V) curves of solar cell, plotted at different cell temperature levels and 1000 W/m2.
Dependence of Solar Cell Electrical Parameters on Temperature
Figure 8. Temperature dependence of (a) series resistance, and (b) shunt resistance, plotted at 1000 W/m2.
Figure 9. Calculated parameters of solar cell as a function of temperature, plotted at light intensity of 1000 W/m2.
Effects of Internal Resistances
Series Resistance
The series resistance of the PV cell is low, and in some cases, it can be neglected. However, to render a model suitable for any given PV cell, it is possible to vary this resistance and predict the influence of its variation on the PV cell outputs. Fig's. (10, 11) are the plots of the (I-V) and (P-V) characteristics for various values of series resistance with fixed values of light intensity (G = 1000 W/m2) and ambient temperature (Tc = 25 °C).
Figure 10. (I-V) characteristic curves, plotted at different series resistance values.
Figure 11. (P-V) characteristic curves, plotted at different series resistance values.
Figure 12 shows Solar cell parameters (Isc, Voc, Pmax. and FF) resulting from model simulations as a function of series resistance, plotted at light intensity of 1000 W/m2, and temperature of 25 °C.
Figure 12. Solar cell parameters resulting from model simulations as a function of series resistance, plotted at light intensity of 1000 W/m2 and temperature of 25 °C.
Shunt Resistance
The modeling was performed for two different Rsh values of 1.0 Ω and 500 Ω, as an example (Fig's. 13, 14).
Figure 13. (I-V) characteristic curves plotted at different shunt resistance values.
Figure 14. (P-V) characteristic curves plotted at different shunt resistance values.
The effect of the shunt resistance (Rsh) on the electrical performances of the cell was shown in Fig. (15), at 1000 W/m2 and 25 °C.
Figure 15. Dependence of solar cell parameters on the shunt resistance (Rsh), plotted
at light intensity of 1000 W/m2 and ambient temperature of 25 °C.
Discussion
Generally, the output power of the PV cell was shown to be increases with the radiation intensity. Such an increase in the output power is primarily caused by a rise in the Voc and also by the corresponding linear increase in the photocurrent with the irradiation intensity. On the other hand, there is a linear boost in the Isc in line with the minority carrier concentration, due to the increase in irradiation intensity (Figs. 2, 3) [17].
From Fig. (4), it is clear that Rs decreases continuously with increasing the intensity of illumination (Fig. 4a). It may be noted from the figure that Rs decreases with the increase of intensity up to 50 W/m2 and then saturates with the further increase in intensity. The decrease can be attributed to the increase in conductivity of the active layer of the cell with the increase in the intensity of illumination [18].
On the other hand, for low illumination levels, up to around 400 W/m2, the shunt resistance was shown to be increase, slightly (Fig. 4b). But, for high illumination levels, it starts to increase rapidly. The increase of Rsh with intensity of illumination at low values may be due to the existence of local in-homogeneities leading to non uniform current flow or to charge leakage a cross the pn junction in the cell. This is because generally shunt is associated with the localized defect regions which in turn have a larger concentration of traps that make them electrically active. These traps act as sinks for majority carriers or photo-generated minority carriers depending on the nature of the traps. Traps capture carriers from the neighboring regions. The electrical activity of traps is stronger at low current densities under dark or at low illumination intensities. In a solar cell, a defect region makes a poor cell than the defect free region and both the cells are connected in parallel. At any operational point above the short circuit, this gives rise to a circulation current. This is equivalent to a shunt current. As the illumination intensity increases, the traps start getting filled and this reduces the shunt current and thus increases the shunt resistance of the cell. At a certain value of the illumination intensity, all traps get filled and then the shunt resistance attains a maximum value for further increase in the illumination intensity unless the high intensity of illumination causes some other effect, e.g. the heating of the cell that may degrade the shunt resistance [10].
For an ideal cell, Rsh would be infinite and would not provide an alternate path for current to flow, while Rs would be zero, resulting in no further voltage drop before the load. Decreasing Rsh and increasing Rs will decrease the Fill Factor (FF) and Pmax as shown in Fig. (5). If Rsh is decreased too much, Voc will drop, while increasing Rs excessively can cause Isc to drop instead. According to Schottky equation, both Isc and the Voc are dependent on the light intensity. The current at short circuit increases linearly as the light intensity increases, since the photon-to-current conversion rate increases. On the other hand, the open-circuit voltage increases logarithmically, following the distribution of the energy states in the semiconductor. The maximum power point, Pmax, also, increases linearly with the light intensity (Fig.5). Finally, Fig. (5b) shows FF as a function of illumination intensity, from which, it is clear that FF is always less than one due to internal resistance within the cell, as well as, external shunt resistance in the circuit.
Additionally, the efficiency of the solar cells falls when temperature increases, mainly, due to the decrease of the open circuit voltage (Fig. 6) [19].It is clearly shown that the output power is a direct function of the cell temperature, the matter is mainly due to as temperature increases, the band gap of the intrinsic semiconductor shrinks, and the open circuit voltage (Voc) decreases following the p-n junction voltage temperature dependency of seen in the diode factor q/kT. Solar cells therefore have a negative temperature coefficient of Voc. Moreover, a lower output power results given the same photocurrent because the charge carriers are liberated at a lower potential. Using the convention introduced with the Fill Factor calculation, a reduction in Voc results in a smaller theoretical maximum power Pmax = I sc ×Voc given the same short-circuit current Isc [20].
It is obvious from the Fig. (8a) that Rs increases with temperature, where, the increase being sharper for the low-temperatures region than for the high-temperature region [18]. Finally, considering the Rsh, it is clear that, for maximum efficiency of a solar cell, the highest shunt resistance is needed (Fig. 8b). Finally, it is proved that the shunt resistance value decreases pronouncedly as a function of temperature [21].
With increase in temperature, the rate of photon generation increases, thus reverse saturation current increases rapidly (Eq. 4) and this result on reduction in band gap. Hence, this leads to marginal changes in current but major changes in voltage (Fig. 9a) at fixed values of light-intensity [22]. As temperature increases, again the band gap of the intrinsic semiconductor shrinks meaning more incident energy is absorbed because a greater percentage of the incident light has enough energy to raise charge carriers from the valence band to the conduction band. A larger photocurrent results; therefore, Isc increases for a given insolation, and solar cells have a positive temperature coefficient of Isc [20], the short circuit current increased by 2.46 mA°C-1 at 1000 W/m2.
Figure (9a) shows the open-circuit voltage dependence on temperature, plotted under constant illumination intensity (1000 W/m2). The Voc will rapidly decline due to the exponential dependence of the saturation current Is on the temperature [17]. Moreover, an approximately linear relationship like Voc µ-T is encountered in the temperature range [23]. At T=100 °C and the highest illumination intensity used, 1000 W/m2, the Voc is 0.337 V. Upon cooling the sample to T= 0°C, the Voc increases to 0.723 V. The temperature coefficient obtained for the simulation of Voc results dVoc/dT» - 4.0 mV°C-1. On the other hand, it is clear from Fig. (9b) that cell temperature significantly decreases the power output of the solar panel. Finally, the Fill Factor was shown to be decreased with increasing temperature, as shown in Fig. (9b). Where, an initial FF value of 0.78, measured at room temperature level (25°C), was shown to decrease down to 0.64, measured at T=100°C. On the other hand, its value was shown increase up to 0.82, measured at 0°C.
As seen in Fig's. (10, 11), the presence of series resistance limits the current output and causes a drop in voltage at a specific current which lowers the Fill Factor of the curve. Increasing the series resistance results in the I-V characteristic becoming flattened at the knee and at high series resistances the curve resembles the ohmic behavior of a resistor [24].
The series resistance is caused by the movement of electrons through the emitter and base of the solar cell, the contact resistance between the metal contact and the silicon and the resistance of metal grids at the front and the rear of the solar cell. The shunt resistance is due to manufacturing defects and also lightly by poor solar cell design. It corresponds to an alternate current path for the photocurrent. Series resistance Rs has been recognized as one of the key parameters affecting the performance of photovoltaic devices through reduction of the solar cell Fill Factor (Eq. 9). For solar cell, keeping the series resistance (Rs) as low as possible is of paramount importance because its increase causes power loss due mainly to a decrease of short-circuit current, maximum power and Fill Factor of the solar cell [25] as shown in Fig. (12). On the other hand, the value of the open-circuit voltage was shown to be independent of Rs, at constant light intensity=1000 W/m2 and ambient temperature=25 °C (Fig. 12a).
Contrarily to the series resistance, the shunt resistance (Rsh) must be higher to avoid current loss at the junction diminishing the photocurrent and hence the solar cell performance [23]. It is well known that the shunt resistance of any PV cell should be large enough for higher output power and Fill Factor. It is observed that the smallest value of Rsh causes PV cell current to fall more steeply indicating higher power loss and low Fill Factor [26].
The analysis of Figure (15), it is clear that for sufficiently small Rsh values, the power losses in solar cells are mainly due to that an alternate current path for the light-generated current. Such a diversion reduces the amount of current flowing through the solar cell junction and reduces the voltage from the solar cell. In addition, at lower voltages where the effective resistance of the solar cell is high, the impact of a resistance in parallel is large. At large values of Rsh up to 50 W the values of Isc, Voc, Pmax and FF are constant with increasing Rsh.
Conclusions
Since the field tests can be expensive and depend primarily on weather conditions it is very convenient to have simulation models to enable work at any time. For this reason the present paper investigates a simple one-diode mathematical model, which was implemented applying MATLAB script. The model can be considered as an easy, simple, and fast tool for characterization of different types of solar cells, as well as, determines the environmental conditions effect on the operation of the proposed system. We can conclude that the changes in irradiation mainly affect the output current, while the changes in temperature mainly influence the output voltage.
References
1. Samer S., Ahmed M., Mohieddine B., Shehab A., A Matlab/Simulink-Based Photovoltaic Array Model Employing SimPowerSystems Toolbox, Journal of Energy and Power Engineering, 2012, 6, p. 1965-1975.
2. Ramos-Hernanz J. A., Campayo J. J., Zulueta E., Barambones O., Eguía P., Zamora I., Obtaining the Characteristics Curves of a Photocell by Different Methods, International Conference on Renewable Energies and Power Quality (ICREPQ13), Bilbao (Spain), 11, 2013, p. 20-26.
3. Surya K. J., Sai B. Ch., Mathematical Modeling and Simulation of Photovoltaic Cell using Matlab-Simulink Environment, Intr. Jour. of Electrical and Computer Eng. (IJECE), 2012, 2(1), p. 26-34.
4. El-Negamy M. S., Eteiba M. B., El-Bayoumi G. M., Modeling and Simulation of Egyptsat-1 Satellite System Powered by Photovoltaic Module, Journal of American Science, 2013, 9(1), p. 110-116.
5. Amita M., Ashfaq K. Md., Mukta S., Development and Simulation of Solar Photovoltaic Model Using Matlab/Simulink, International Journal on Emerging Technologies, 2013, 4(1), p. 62-65.
6. Kashif I., Zainal S., An Improved Modeling Method to Determine the Model Parameters of Photovoltaic (PV) Modules Using Differential Evolution (DE), Science-Direct, Solar Energy, Elsevier Ltd., 2011, 85, p. 23492359.
7. Abdul J., Nazar. A, Omega A. R, Simulation on Maximum Power Point Tracking of the Photovoltaic Module Using LabVIEW, International Journal of Advanced Research in Electrical, Electronics and Instrumentation Engineering , 2012, 1(3), p. 190-199.
8. Rikesh S., Moumi P., Analysis of Photovoltaic Cells With Closed Loop Boost Converter, Intr. Jour, of Advances in Eng. & Technology, 2013, 6(1), p.304-315.
9. Vandana K., Bijoy K. D., Dinesh B., Matlab/Sim Electronics Models Based Study of Solar Cells, International Journal of Renewable Energy Research, 2013, 3(1), p. 30-34.
10. Firoz K., Singh S.N., Husain M., Effect of Illumination Intensity on Cell Parameters of a Silicon Solar Cell, Solar Energy Materials & Solar Cells, Elsevier, Science-Direct, 2010, 94, p. 1473-1476.
11. Pandiarajan N., Ranganath M., Mathematical Modeling of Photovoltaic Module with Simulink, 1st International Conference on Electrical Energy Systems (ICEES), 2011, p. 258-263.
12. Kashif I., Zainal S., Saad M., Amir S., Parameter Extraction of Solar Photovoltaic Modules Using Penalty-Based Differential Evolution, Applied Energy, Elsevier, Science-Direct, 2012, 99, p. 297-308.
13. Huan-Liang T., Ci-Siang T., Yi-Jie S., Development of Generalized Photovoltaic Model Using MATLAB/SIMULINK, Proceedings of the World Congress on Engineering and Computer Science, San Francisco, USA, 2008, October 22 24.
14. Skoplaki E., Palyvos J. A., On the Temperature Dependence of Photovoltaic Module Electrical Performance: A review of efficiency/power correlations, Science-Direct, Elsevier, Solar Energy, 2009, 83(83), p. 614624.
15. Meier D. L., Good E. A., Garcia R. A., Bingham B. L., Yamanaka S., Chandrasekaran V., Bucher C., Determining Components of Series Resistance from Measurements on A Finished Cell, Photovoltaic Energy Conversion, IEEE 4th World Conference on Photovoltaic Energy Conversion, 2006, 2, p. 1315-1318.
16. Ramos-Hernanz J. A., Campayo J. J., Larranaga J., Zulueta E., Barambones O., Motrico J., Fernandez G. U., Zamora I., Two Photovoltaic Cell simulation Models in Matlab in Matlab/Simulink, International Journal on Technical and Physical Problems of Engineering (IJTPE), 2012, 4(10), p. 45-51.
17. Jen-Cheng W., Jyh-Cherng S., Yu-Li S. Kun-Chang K., Yen-Wei C., Yu-Ting L., Jui-Jen C., Kuo-Chi L., Joe-Air J., A Novel Method for the Determination of Dynamic Resistance for Photovoltaic Modules, Energy, 2011, 36, p. 5968-5974.
18. Arora J. D., Verma A. V., Mala B., Variation of series resistance with temperature and illumination level in diffused junction poly- and single-crystalline silicon solar cells, Journal of Materials Science Letters, 1986, 5(12), p. 1210-1212.
19. Huang B. J., Yang P. E., Lin Y. P., Lin B. Y., Chen H. J., Lai R. C., Cheng J. S., Solar Cell Junction Temperature Measurement of PV Module, Elsevier, Science-Direct, Solar Energy, 2011, 85(2), p. 388392.
20. Furkan D., Mehmet E. M., Critical Factors that Affecting Efficiency of Solar Cells, Smart Grid and Renewable Energy, 2010, 1, p. 47-50.
21. Salinger J., Measurement of Solar Cell Parameters with Dark Forward I-V Characteristics, Acta Polytechnica, Czech Technical Univ. Publ. House, 2006, 46(4), p. 25- 27.
22. Pradhan A., Ali S.M, Jena C., Analysis of Solar PV cell Performance with Changing Irradiance and Temperature, International Journal of Engineering and Computer Science, 2013, 2(1), p. 214-220.
23. Germa G.-B., Temperature Dependence of Open-Circuit Voltage in Organic Solar Cells from GenerationRecombination Kinetic Balance, Solar Energy Materials & Solar Cells, Elsevier, Science-Direct, 2010, 94, p. 21662169.
24. Jacqueline L. C., Characterization of Cell Mismatch in Photovoltaic Modules Using Electroluminescence and Associated Electro-Optic Techniques, M.Sc., Fac. of Sci., Nelson Mandela Metropolitan University, 2012.
25. Grégoire S., Senghane M., A Method to Determine the Solar Cell Resistances from Single I-V Characteristic Curves Considering the Junction Recombination Velocity (Sf), International Journal of Pure and Applied Sciences and Technology, 2011, 6(2), p. 103-114.
26. Nema R. K., Savita N., Gayatri A., Computer Simulation Based Study of Photovoltaic Cells/Modules and their Experimental Verification, International Journal of Recent Trends in Engineering (IJRTE), Academy Publisher, 2009, 1(3), p. 151-156.