AC Versus DC Link Comparison Based on Power Flow Analysis of a Multimachine Power System
Mohammed Abdeljalil DJEHAF, Sid Ahmed ZIDI, Youcef DJILANI KOBIBI
Intelligent Control and Electrical Power System Laboratory, Djillali Liabes University of Sidi Bel-Abbes, ALGERIA
E-mails: med_djehaf@yahoo.fr; sbzidi@yahoo.fr; youcef_kobibi@yahoo.fr;
* Corresponding author: +213670104148
Abstract
Deregulation and privatization is posing new challenges on high voltage transmission and on distributions systems as well. An increasingly liberalized market will encourage trading opportunities to be identified and developed. High voltage power electronics, such as HVDC (High Voltage Direct Current) and FACTS (Flexible AC Transmission Systems) provide the necessary features to avoid technical problems in heavily loaded power systems; HVDC offers most advantages: it can be used for system interconnection and for control of power flow as well. The major benefit of HVDC is its incorporated ability for fault-current blocking, which is not possible with synchronous AC links. In addition, HVDC can effectively support the surrounding AC systems in case of transient fault conditions and it serves as firewall against cascading disturbances. This paper presents a comparison between HVDC link and an HVAC link in a 29 Bus multimachine system, based on load flow analysis using Newton-Raphson method for the AC link case, and sequential method for the HVDC link case.
Keywords
AC DC Load Flow; HVDC; Multimachine System; Newton Raphson; Sequential Method
Introduction
In the recent decades, electric power systems have significantly increased around the world. Growing power consumption, long distances transmission, submarine or underground transmission and interconnection between countries or regions with different frequency power system had lead many countries to consider high voltage direct current (HVDC) transmission system as a solution to exert the existing power transmission system more efficiently and satisfy the surge in energy demand. The economics of bulk power transmission by underground equipment is growing in favor of direct current [1].
In addition, many developing countries have the problem of fundamental investment in transmission and distribution systems due to inadequate investment in the past. One solution to reduce the gap between transmission capacity and power demand is employing HVDC transmission system in the existing AC network to achieve economic advantage of the investment [2].
Although the main reason of selecting HVDC transmission lines is often economic, there are some other reasons for HVDC may be the best feasible way to interconnect two asynchronous networks, reduce fault currents, employing in long underground cable circuits, eliminate network congestion, distortion transmit restriction in interconnected system, ability for controlling power line flow, and to mitigate environmental concerns. In all of these applications, HVDC nicely complements the ac transmission system [3, 4].
The options of DC line linking to AC systems are used, as they are better technical alterative and are financially beneficial in certain occasions such as:
to facilitate the operation of interconnected AC systems at different frequencies;
to enhance the operation of AC systems with incompatible frequency control techniques, and to reduce the short circuit level in an interconnected AC system;
to transmits power in underground and submarine cables;
to transfer bulk power over long distances more economically;
to increase the transient stability margin and to improve the dynamic stability
Load flow analysis is an important tool for the planning, operation and control of power system. However, high voltage direct current (HVDC) transmission is now gaining considerable importance not only for long distance but also for underground and submarine transmission, and it becomes necessary to develop a method for carrying out the load flow analysis of an integrated AC-DC power system.
The basic load flow has to be substantially modified to be capable of modeling the operating state of the combined AC and DC systems under the specified conditions of load, generation and DC system control strategies.
Variables of the DC link which have been chosen for the problem formulation are the converter terminal DC voltage, the real and imaginary component of the transformer secondary current, converter transformer tap ratios, firing angle of the rectifier and current of the DC link. Equations relating these six variables and their solution strategy have been discussed.
Many methods have been proposed for AC-DC power flow. These methods in the literature can be separated into two main parts: sequential method and unified method. In sequential method, AC and DC power flow are implemented separately and convergence can be provided by getting back and forward [3-4]. In unified (simultaneous) method, all equations regarding to AC-DC system are one within other and the equations are solved together.
The aim of this paper is to compare the HVDC link and HVAC link in a 29 Bus multimachine system, using the Newton-Raphson method for the AC link case, and the sequential method for the HVDC link case.
Material and Method
AC DC Load Flow
The accurate method of integrating a DC link into the AC load flow is representing buses connected to an HVDC as a PQ-bus with a voltage dependant active and reactive power. However, the voltage dependency of the active and reactive power at these A.C-D.C. buses does not obey the general rules of the conventional PQ-buses in AC systems. We have thus a new type of PQ-bus, which we define as PQDC- bus. In our approach the real and reactive power equations for the PQDC-buses, with their dependency on both the AC voltages at the terminal buses and the characteristics of the DC converters and their control strategies, are derived and integrated into the AC load flow algorithm.
DC System Model
The fundamental component of AC side current is related to DC side current by the relation:
|
|
(1) |
The DC line voltage in rectifier side can be expressed in terms of converter ignition delay angle and DC line current as follows:
|
|
(2) |
The DC line voltage in inverter side can be expressed in terms of converter extinction angle or inverter advance angle and DC line current as follows:
|
|
(3) |
|
|
(4) |
If the converter transformer is lossless, the Active AC power injected at the converter bus may also be equated to the DC power:
|
|
(5) |
where; ф: is the angle between the fundamental component of primary current and converter bus voltage.
Substitute from Equation (1) into Equation (5) yields:
|
|
(6) |
|
|
(7) |
The DC line voltage in rectifier side can be expressed in terms of power factor at rectifier bus as follows:
|
|
(8) |
The reminder independent equation is yields from specified control at both rectifier and inverter stations. The following valid control equations can be used with each control method:
For constant DC current control, CC, the control equation is:
|
|
(9) |
For constant DC voltage control, CDV, the control equation is:
|
|
(10) |
For constant ignition delay control, CDA, the control equation is:
|
|
(11) |
For constant extinction control, CEA, the control equation is:
|
|
(12) |
For constant tap changer control, the control equation is:
|
|
(13) |
For constant power control, CP, the control equation is:
|
|
(14) |
The DC model can be summarized as follows:
|
|
(15) |
where:
|
|
(16) |
|
|
(17) |
|
|
(18) |
|
|
|
|
|
|
and;
|
|
(19) |
Note that: each converter has five variables so that each one required five independent algebraic equations.
AC System Model
The AC system model consists of sets of mismatches of active power and reactive power equations. The mismatch of active power and reactive power at any AC bus is:
|
|
(20) |
|
|
(21) |
|
|
(22) |
|
|
(23) |
|
|
(24) |
|
|
(25) |
And i: is the bus number
n: is the total number of AC buses
|
|
(26) |
|
|
(27) |
Equations (20) and (21) is modified for converter AC bus as follows:
|
|
(28) |
|
|
(29) |
where;
|
|
(30) |
|
|
(31) |
or
|
|
(32) |
Solution Methodology
The solution methodology AC-DC power flow can be classified into two methods: Unified method and Sequential Method
1- Unified Method
In unified method, the AC and DC equations are solved together. The simplest implementation of this approach is to consider all the nonlinear algebraic equations, for both AC and DC systems, combined into one set of nonlinear algebraic equations. The Newton-Raphson method is used here to solve this set of equations. The Newton-Raphson equation can be written as follows:
|
|
(33) |

where ![]() is the Jacobian matrix, which can be
written as follows:
is the Jacobian matrix, which can be
written as follows:
|
|
(34) |

So that to obtain the new values of system variables for iteration k we can use the following steps:
|
|
(35) |
|
|
(36) |


2- Sequential Method
In sequential method, the AC and DC equations are solved individually. The Newton-Raphson method is used here to solve this set of equations. The Newton-Raphson equation can be written as follows:
|
|
(37) |
|
|
(38) |

where ![]() is the Jacobian matrix, which can be
written as follows:
is the Jacobian matrix, which can be
written as follows:
|
|
(39) |
|
|
(40) |

The following steps are repeated to evaluate the system variables, as shown in Figure1.
Figure 1. Flow chart of the sequential method
It is to be noted that if the taps are continuous and unlimited, then there is no need for iteration between AC and DC solutions.
The initial calculations of P and Q at each converter are final and used for AC solution, the voltages calculated from AC power flow are then used to calculate transformer taps.
System investigated
The model shown in Figure 2 presents a 29 Bus 735-kV transmission network with seven 13.8 kV power plants (total available generation =26200 MVA) including hydraulic turbines. The 735-kV transmission network is both series and shunts compensated using fixed capacitors and inductors. The load is lumped at two buses (MTL7 and QUE7).
The MTL Load subsystem connected to the MTL7 bus consists of four types of load blocks connected on the 25 kV distribution systems through 735 kV /230 kV and 230 kV/ 25 kV transformers.
The QUE Load and Wind Generation subsystem uses a 6000 MW load (constant Z and constant PQ) connected on the 120 kV bus. A 9 MW wind farm using an asynchronous generator is connected to the 120 kV bus through a 25-kV feeder and a 25 kV/120 KV transformer.
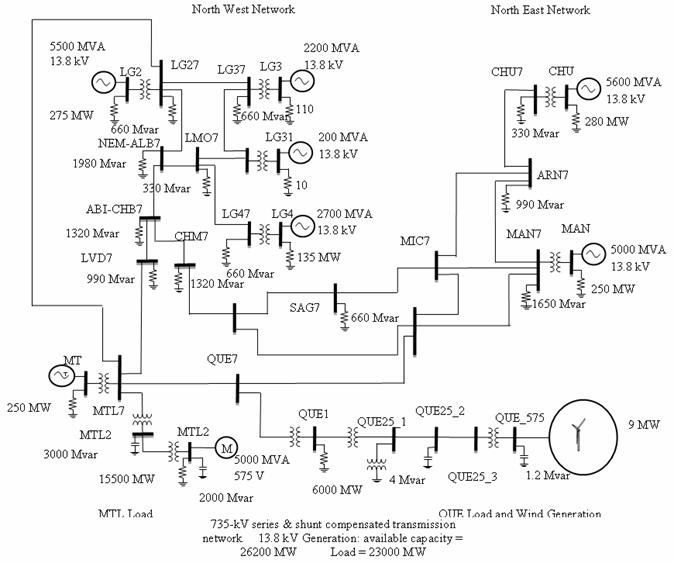
Figure 2. 29 Bus Multimachine system with integrated DC link
The AC line between bus MTL7 and bus LG27 is replaced by the 800 Km HVDC systems as shown in the Figure 3. Table.1 shows the HVDC link characteristics.
Table 1. HVDC link parameter
|
|
Rectifier |
Inverter |
|
Bus |
MTL7 |
LG27 |
|
Commutation reactance |
0.01Ω |
0.11Ω |
|
Minimum control angle |
αmin=14° |
γmin=20° |
|
Transformer regulation range |
0.93 p.u |
0.91 p.u |
|
Resistance of the DC line |
12.0+2*0.3Ω |
|
|
Rated DC power at inverter |
1000MW |
|
|
Rated DC voltage at inverter |
500Kv |
|
Figure 3. Replacement of the AC link by DC link
Results
A DC load flow program with the integrated A.C.-D.C. algorithm has been written in MATLAB. The program is applied on the 29 bus AC test system with an integrated two terminal HVDC link.
For this model the sequential method has been used to solve the power flow.
The Load Flow tool of the Powergui block of the toolbox simpowersystem uses the Newton-Raphson method and comes with a graphical user interfaces that allows you to display load flow solution at all buses, we have used it to solve the load flow for the AC system.
Convergence within a tolerance of max(∆x) = 0.0001 is achieved in 4 iteration steps; Table 2 shows the A.C load flow of the power system without HVDC system and with HVDC system.
Table 2. AC load flow results
|
|
With AC Line |
With HVDC system |
||||||
|
Bus |
V (p.u) |
δ (degree) |
P (MW) |
Q (Mvar) |
V (p.u) |
δ (degree) |
P (MW) |
Q (Mvar) |
|
MTL_13.8 |
1.00 |
-37.47 |
4750 |
-3075.6 |
1.00 |
-46.81 |
4750 |
-1348.02 |
|
MTL7 |
1.08 |
-13.03 |
0 |
0 |
1.03 |
-22.51 |
1.28 |
-159.19 |
|
QUE7 |
1.09 |
-6.09 |
0 |
0 |
1.04 |
-14.11 |
0.00 |
0.00 |
|
SAG7 |
1.10 |
6.29 |
2.64 |
793.45 |
1.05 |
0.33 |
2.43 |
729.34 |
|
MTL2 |
1.08 |
-47.43 |
0 |
-3467.74 |
1.03 |
-57.16 |
0.00 |
-3193.09 |
|
MTL_25 |
1.06 |
-84.63 |
16055.24 |
281.16 |
1.02 |
-94.82 |
15689.47 |
-2060.69 |
|
LG31_13.8 |
1.00 |
0.75 |
190 |
-22.3 |
1.00 |
0.24 |
190 |
4.16 |
|
LVD7 |
1.13 |
-3.95 |
4.22 |
1266.54 |
1.07 |
-11.19 |
3.78 |
1134.95 |
|
CHM7 |
1.12 |
2.45 |
5.55 |
1664.07 |
1.06 |
-3.43 |
4.99 |
1496.68 |
|
LG47 |
1.03 |
22.62 |
2.33 |
699.38 |
1.01 |
20.98 |
2.24 |
672.59 |
|
LG3_13.8 |
1.00 |
0.20 |
1910 |
-256.59 |
1.00 |
-0.32 |
1910.00 |
34.31 |
|
LG4_13.8 |
1.00 |
-1.49 |
2635 |
-612.3 |
1.00 |
-3.05 |
2635.00 |
-163.45 |
|
LG2_13.8 |
1.00 |
0.00 |
6168.78 |
-1425.74 |
1.00 |
0.00 |
5843.80 |
-500.55 |
|
LG27 |
1.03 |
23.15 |
2.36 |
706.53 |
1.01 |
23.99 |
3.48 |
523.84 |
|
LG37 |
1.02 |
24.98 |
2,27 |
680.46 |
1.00 |
24.41 |
2.20 |
659.38 |
|
LMO7 |
1.06 |
19.40 |
1.23 |
368.06 |
1.02 |
17.62 |
1.16 |
346.58 |
|
NEM_ALB7 |
1.09 |
12.20 |
7,91 |
2373.08 |
1.04 |
9.37 |
7.18 |
2153.43 |
|
ABI_CHB7 |
1.12 |
5.46 |
5.56 |
1667.95 |
1.06 |
0.70 |
4.97 |
1492.45 |
|
CHU_13.8 |
1.00 |
10.60 |
5280 |
-646.51 |
1.00 |
4.83 |
5280 |
-415.71 |
|
CHU7 |
1.02 |
34.88 |
1.14 |
340.51 |
1.01 |
29.08 |
1.12 |
337.21 |
|
MAN_13.8 |
1.00 |
-9.71 |
4750 |
-1680.3 |
1.00 |
-15.96 |
4750 |
-889.9 |
|
ARN7 |
1.08 |
19.07 |
3.85 |
1154.29 |
1.06 |
12.95 |
3.72 |
1115.10 |
|
MAN7 |
1.04 |
14.62 |
5.97 |
1792.49 |
1.02 |
8.29 |
5.76 |
1727.94 |
|
MIC7 |
1.08 |
12.59 |
0 |
0 |
1.05 |
6.31 |
0.00 |
0.00 |
|
QUE_575 |
1.11 |
-64.81 |
-7.95 |
1.99 |
1.05 |
-72.49 |
-7.94 |
2.18 |
|
QUE_25_1 |
1.09 |
-71.88 |
0 |
0 |
1.03 |
-80.47 |
0.00 |
0.00 |
|
QUE1 |
1.08 |
-43.10 |
6000 |
0 |
1.03 |
-51.82 |
6000 |
-0.00 |
|
QUE_25_2 |
1.12 |
-69.34 |
0 |
-4.99 |
1.06 |
-77.57 |
0.00 |
-4.49 |
|
QUE_25_3 |
1.12 |
-66.35 |
0 |
0 |
1.06 |
-74.22 |
0.00 |
0.00 |
|
*1* |
1.08 |
-41.96 |
0 |
0 |
1.03 |
-50.56 |
0.00 |
0.00 |
|
Total Losses |
|
|
1106.96 |
23142.71 |
|
|
848.73 |
19826.40 |
The DC load flow results are given in Table3.
Table 3. DC load flow results
|
|
Rectifier |
Inverter |
|
D.C Voltage (kV) |
524.63 |
499.40 |
|
Control Angles |
14.86 |
145.50 |
|
Transformer Tap Position |
0.95 |
1.00 |
|
Real Power (MW) |
1055.87 |
994.65 |
|
Reactive Power (Mvar) |
456.21 |
517.35 |
Discussion
It can be seen from Table 1 that active and reactive power losses of power system without HVDC are around 1106.96 MW and 23142.71Mvar, respectively. However, with HVDC system, the active and reactive power losses are decreased to 848.73 MW and 19826.40 Mvar, respectively.
Figure 4. Voltage profile without HVDC and with HVDC
Compare to AC line the effect of HVDC on total system losses is greater, the voltages are also lower, and present a voltage profile within the limits as shown in Figure 4, and an improved power flow by relieving most of the overloaded lines such as line SAG7, LVD7, NEM_ALB7 , by enhancing the active power flow in under loaded lines. The DC link has more capacity for active power transfer in comparison to the original AC line, which was transporting a considerable amount of reactive power.
It can be clearly seen in Table 2 that the inverter bus sustains a considerable voltage drop due to the HVDC link failing to transport the reactive power consumed at the node from the MTL generator. The reactive power is supplied from generator LG2_13.8 instead, and thus the increase in at bus LG2_13.8.
In power control mode, either the rectifier or the inverter is chosen as the slack station compensating for DC link losses.
The main rectifier control mode is the DC power, set at 1000 MW to be received at the inverter (the rectifier is chosen to be the slack station). The auxiliary mode, when there is a dip in AC voltage would be the alpha minimum mode, set to 5°. At the inverter, the main control mode is the DC voltage, set at 500 kV. The auxiliary mode, when there is a dip in AC voltage would be the minimum extinction angle gamma set to 17°. The tap changer control is set to hold α angle between 14° and 17° at the rectifier and the g angle between 20° and 23° at the inverter.
Conclusions
It is shown from simulation results that the AC line has no power flow control capabilities and the distribution of the power flows is determined by Kirchoff's law. However, the HVDC not only can control power flow through the transmission line but also can decrease the transmission line losses and maintain the voltage at constant value.
Appendix
The HVDC link is shown in figure 5 and its data is given as follow
Figure 5. HVDC link
Given:![]() ,
,![]() ,
,![]() ,
,![]()
![]() ,
, ![]() ,
, ![]()
![]() ,
, ![]()
![]() ,
, ![]() ,
, ![]() ,
, ![]()
References
1. Yu J., Yan W., Li W., Wen L., Quadratic Models of ACDC Power Flow and Optimal Reactive Power Flow with HVDC and UPFC Controls, Elsevier Electric Power Systems Research, 2008, 78(3), p. 302-310.
2. Panosyan A., Oswald B.R., Modified Newton-Raphson Load Flow Analysis for Integrated AC/DC Power Systems, Universities Power Engineering Conference, 2004, UPEC, 2004, 39th International, 2, p. 1223-1227.
3. Adepoju G.A., Komolafe O.A., Aborisade D.O., Power Flow Analysis of the Nigerian Transmission System Incorporating Facts Controllers, International Journal of Applied Science and Technology, 2011, 5, p. 186-200.
4. Sheng-Huei L., Chia-Chi C., A Web-Based Power Flow Calculation of Large-Scale Power Systems Embedded with VSC-based HVDC systems, 2005 IEEE/PES Transmission and Distribution Conference & Exhibition: Asia and Pacific Dalian, China, p. 1-9.
5. Povh D., Retzmann D., Teltsch E.U.K., Mihalic R., Advantages of Large AC/DC System Interconnections, Report B4-304, CIGRE Session 2006, Paris.
6. Breuer W., Hartmann V., Povh D., Retzmann D., Teltsch E., Application Of HVDC For Large Power System Interconnections, Report B4-106, CIGRE Session 2004, Paris.
7. Jogendranath M.S., Pavan Kumar G., Power Flow Control in HVDC Link Using PI and Ann Controllers, International Journal of Engineering Research and Development, 2012, 4(9), p. 52-58.
8. Kumkratug P., Fast Decoupled Power Flow for Power System with High Voltage Direct Current Transmission Line System, American Journal of Applied Sciences, 2010, 7(8), p. 1115-1117.
9. Grünbaum R., Halvarsson B., Wilk-Wilczynski A., FACTS and HVDC Light For Power System Interconnections, Power Delivery Confererence, Madrid, Spain, September 1999.
10. Pérez de Andrés J.M., Mühlenkamp M., Retzmann D., Walz R., Prospects for HVDC- Getting more Power out of the Grid, Report B4( HVDC and Power Electronics ), Madrid, 29-30 November 2006.
11. Dusan Povh, Dietmar Retzmann, Integrated AC/DC Transmission Systems Benefits of Power Electronics for Security and Sustainability of Power Supply, PSCC 2008, Glasgow, July 14-17, 2008, Survey Paper 2 - Part 1.
12. Harker B.J, Steady State Analysis of Integrated AC and DC Systems, Theses and Dissertations, University of Canterbury, Electrical Engineering, Christchurch, New Zealand, 1980.
13. Simpowersystems toolbox. MathWorks, http://www.MathWorks.com/products/simpower (accessed 2012).