Improvement of Voltage Stability in Electrical Network by Using a STATCOM
Kamel MERINI*, Fatima Zohra GHERBI
Electrical Engineering Department. Intelligent Control and Electrical Power System Laboratory (ICEPS),
E-mails: k_controle@yahoo.fr; fzgherbi@gmail.com
(* Phone/Fax: 213 48 64 66 09)
Abstract
This paper aims to clarify power flow without and with static synchronous compensator (STATCOM) and searching the best location of STATCOM to improve voltage in the Algerian network. In daily operation where there are all kinds of disturbances such as voltage fluctuations, voltage sags, swells, voltage unbalances and harmonics. STATCOM is modeled as a controllable voltage source. To validate the effectiveness of the Newton-Raphson method algorithm was implemented to solve power flow equations in presence of STATCOM. Case studies are carried out on 59-bus Algerian network test to demonstrate the performance of proposed models. Simulation results show the effectiveness and capability of STATCOM in improving voltage regulation in transmission systems; moreover the power solution using the Newton-Raphson algorithm developed. The STATCOM and the detailed simulation are performed using Matlab program.
Keywords
Power Flow; Static Synchronous Compensator; Newton-Raphson Algorithm; Matlab Program.
Introduction
Transmission lines are often driven close to or even beyond their thermal limits in order to satisfy the increased electric power consumption and trades due to increase of the unplanned power exchanges. If the exchanges were not controlled, some lines located on particular paths may become overloaded, this phenomenon is called congestion.
Political and environmental constraints make the building of new transmission lines difficult and restrict the electrical utilities from better use of existing network. It is attractive for electrical utilities to have a way of permitting more efficient use of the transmission lines by controlling the power flows.
The development and use of FACTS controllers in power transmission systems has led to many applications of these controllers to improve the stability of power networks [1, 2]. The objective principal to use FACTS technology for the operators of the electric power is to have an opportunity for the control of the power flow and by increasing the capacities usable of these lines under the normal conditions. The parameter and variables of the transmission line, i.e., line impedance, terminal voltages, and voltage angles can be controlled by FACTS devices in a fast and effective way [3]. FACTS devices increases power handling capacity of the line and improve transient stability as well as damping performance of the power system [4, 5]. According to the specialized literature we find several types of FACTS [6, 7], in our work we limited to the study a great disturbance, so the FACTS element used for reactive power compensation both assuring the low cost and high efficiency is STATCOM. The static synchronous compensators (STATCOM) consist of shunt connected voltage source converter through coupling transformer with the transmission line. STATCOM can control voltage magnitude and the phase angle in a very short time and therefore, has ability to improve the system [4, 5].
The successful application of STATCOM home and abroad means the STATCOM is mature in technique [8]. At present the researches on STATCOM mainly concentrate on modeling and controller design to STATCOM [9].
Therefore, the objective of the present paper is to develop STATCOM model and their implementation in Newton-Raphson power flow algorithm and to find the best location of STATCOM to improve the voltage regulation in the Algerian network.
Material and Method
Power Flow Equation
Basically load flow problem involves solving the set of non-linear algebraic equations which represent the network under steady state conditions. The reliable solution of real life transmission and distribution networks is not a trivial matter and Newton-type methods, with their strong convergence characteristics, have proved most successful. To illustrate the power flow equations, the power flow across the general two-port network element connecting buses k and m shown in Figure 1 is considered and the following equations (1) to (4) are obtained.
The injected active and reactive power at bus-k (P k and Q k) is:
|
Pk= GkkVk2 + (Gkmcosδkm+ Bkmsinδkm)VkVm |
(1) |
|
Qk = - BkkVk2 + (Gkmsinδkm- Bkmcosδkm)VkVm |
(2) |
|
Pk = GmmVm2 + (Gmkcosδmk+ Bmksinδmk)VkVm |
(3) |
|
Qk = - BmmVk2 + (Gmksinδmk- Bmkcosδmk)VkVm |
(4) |
where: Pk: Real power injection at bus k; Qk: Reactive power injection at bus k; Vk: Magnitude of voltage at bus k; Vm: Magnitude of voltage at bus k; δkm: Phasor angle of an element of the network admittance matrix; Gkm: Element of the real part of network admittance matrix; Bkm: Element of the imaginary part of the network admittance matrix; δkm = δk - δm = - δm; Ykk = Ymm = Gkk + jBkk = Yko + Ykm; Ykm = Ymk = Gmk + jBkm = - Ymk
The nodal power flow equations:
|
P = f (V, θ, G, B) Q = g (V, θ, G, B) |
(5) |
Figure 1. General two-port network
|
|
(6) |
where, P and Q are vectors of real and reactive nodal power injections as a function of nodal voltage magnitudes V and angles θ and network conductances G and suceptances B.
Δ P = P spec – P cal is the real power mismatch vector, Δ Q = Q spec – Q cal is the reactive power mismatch vector, Δθ and Δv are the vectors of incremental changes in nodal voltage magnitudes and angles, J is the matrix of partial derivatives of real and reactive power with respect to voltage magnitudes and angle i indicates the iteration number.
Incorporation of FACTS devices in an existing load flow algorithm results in increased complexity of programming due to the following reasons:
- New terms owing to the contributions from the FACTS devices need to be included in the existing power flow equations of the concerned buses. These terms necessitate modification of existing power flow codes.
- New power flow equations related to the FACTS devices come into the picture, which dictate formulation of separate subroutine(s) for computing them;
The system Jacobian matrix contains entirely new Jacobian sub-blocks exclusively related to the FACTS devices. Therefore, new codes have to be written for computation of these Jacobian sub-blocks.
The increase in the dimension of Jacobian matrix, compared with the case when there are no power system controllers, is proportional to the number and kind of such controllers.
The simultaneous equations for the networks and power system state variables are:
|
f (X nsys, R nf ) g (X nsys, R nf ) |
(7) |
where: X nsys = Network state variables i.e. (voltage magnitudes and phase angles); R nf = Power system controller variables.
The Structure of STATCOM
A. The voltage converter
The simplest structure of STATCOM is given in Figure 2.
The STATCOM consists of a coupling transformer, a voltage converter, and a source of storage for the DC side [10, 11]. The coupling transformer has two roles [10]:
- Linking the system AC with STATCOM
- The link inductor has the advantage that the source DC is not short-circuited
The STATCOM can consist of a power inverter "CSI: current source inverter", but for cost and current is unidirectional, it is preferable to use a voltage converter; virtually is the most used [10, 13].
The inverter constituting the STATCOM can be composed of GTO or the IGBT.
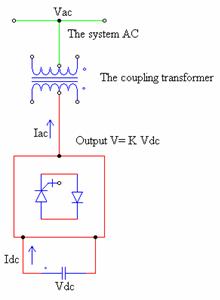
Figure 2. The model of STATCOM
B. The static characteristic of STATCOM
Figure 3 shows the static characteristic of STATCOM. It is capable of controlling its current estimated maximum regardless of system voltage AC is a medium voltage in case of major system disturbances. Figure 3 shows the ability of STATCOM to maintain as the capacitive current at voltages very low system [14, 15]. The estimated value of the current spike in the inductive side is greater than the rated capacitive switching is the natural GTO used in the inductive side, it is limited by the current of the diode, but in the side this capacitive current is determined by switching drilled GTO used [12, 16].
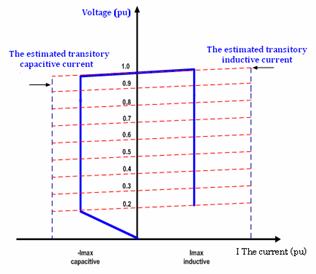
Figure 3. The static characteristic of STATCOM
Power System with STATCOM
Figure 4 shows the circuit model of a STATCOM connected to Bus k of an N-Bus power. The STATCOM is modeled as a controllable voltage source (Estat) in series with impedance. The real part of this impedance represents the ohmic losses of the power electronics devices and the coupling transformer, while the imaginary part of this impedance represents the leakage reactance of the coupling transformer. Assume that the STATCOM is operating in voltage control mode. This means that the STATCOM absorbs proper amount of reactive power from the power system to keep│Vk│constant for all power system loading within reasonable range. The ohmic loss of the STATCOM is accounted by considering the real part of Ystat in power flow calculations. The net active/reactive power injection at Bus k including the local load, before addition of the STATCOM, is shown by Pk+jQ k.
The power flow equations of the system with STATCOM connected to Bus k, can be written as:
|
|
(8) |
|
|
(9) |
|
|
(10) |
|
|
(11) |
where, │Estat│, δ stat , │Ystat│and θ stat are shown in Figure 4.
Addition of STATCOM introduces two new variables │Estat│ and δ stat; however, │Vk│ is now known. Thus, one more equation is needed to solve the power flow problem.
Equation (11) is found using the fact the power consumed by the source Estat (PE stat) must be zero in steady state. Thus the equation for PE stat is written as:
|
|
(12) |
Using these power equations, the linearized STATCOM model is given below:
|
|
(13) |

Figure 4. Steady state model of STATCOM
Results and Discussion
The test system used the example of Algerian network. It consists of 59 buses, 83 branches (lines and transformers) and 10 generators. The proposed algorithm is developed in the Matlab programming language using version 6.5.The behavior of the test system with and without STATCOM is studied the best location of the STATCOM to improve the voltage in this network. Two cases of power flow analysis are considered. Case 1 assumes the study power flow without any compensation. Case 2 assumes the study power flow with STATCOM.
Case 1:
For the system without STATCOM, the the voltage magnitude of load buses given by the load flow program, design that the voltage magnitude at buses 7, 8, 9, 11, 14, 17, 47, 48, 49 and 56 are inferior at 1.0 p.u, and drop the voltage magnitude at bus 48. When STATCOM is connected at bus 17 we observe that the voltage magnitude at bus 17 has been improved to 1.0 p.u and the voltage magnitude of buses 7, 8, 9, 11, 14, 17, 47, 48, 49 and 56 are also improved but the drop voltage has been not improved at bus 48. Table 1 and Figure 5 show the results for the voltage before and after the STATCOM placement.
Table 1. Voltage results with and without STATCOM
|
Bus N° |
V (pu) without STATCOM |
V (pu) with STATCOM |
Bus N° |
V (pu) without STATCOM |
V (pu) with STATCOM |
|
1 |
1.0600 |
1.0600 |
31 |
1.1084 |
1.1085 |
|
2 |
1.0500 |
1.0500 |
32 |
1.1066 |
1.1066 |
|
3 |
1.0600 |
1.0600 |
33 |
1.10621 |
1.0622 |
|
4 |
1.0383 |
1.0283 |
34 |
1.1062 |
1.1063 |
|
5 |
1.0297 |
1.0298 |
35 |
1.0404 |
1.0405 |
|
6 |
1.0605 |
1.0607 |
36 |
1.0273 |
0.9543 |
|
7 |
0.9975 |
0.9975 |
37 |
1.0273 |
1.0273 |
|
8 |
0.9886 |
0.9890 |
38 |
1.0099 |
1.0102 |
|
9 |
0.9927 |
0.9929 |
39 |
1.0057 |
1.0080 |
|
10 |
1.0751 |
1.0751 |
40 |
1.0767 |
1.0767 |
|
11 |
0.9970 |
0.9970 |
41 |
1.0966 |
1.0966 |
|
12 |
1.0142 |
1.0142 |
42 |
1.0440 |
1.0440 |
|
13 |
1.1034 |
1.1035 |
43 |
1.0416 |
1.0417 |
|
14 |
0.9758 |
0.9761 |
44 |
1.0171 |
1.0179 |
|
15 |
1.0689 |
1.0689 |
45 |
1.0527 |
1.0529 |
|
16 |
1.1004 |
1.1005 |
46 |
1.0052 |
1.0052 |
|
17 |
0.9971 |
1.0000 |
47 |
0.9654 |
0.9654 |
|
18 |
1.1046 |
1.1047 |
48 |
0.9289 |
0.9289 |
|
19 |
1.1036 |
1.1037 |
49 |
0.9768 |
0.9768 |
|
20 |
1.0537 |
1.0537 |
50 |
1.1122 |
1.1123 |
|
21 |
1.0815 |
1.0815 |
51 |
1.1114 |
1.1114 |
|
22 |
1.1004 |
1.1004 |
52 |
1.0805 |
1.0806 |
|
23 |
1.0162 |
1.0162 |
53 |
1.1139 |
1.1140 |
|
24 |
1.0194 |
1.0194 |
54 |
1.0679 |
1.0680 |
|
25 |
1.0105 |
1.0110 |
55 |
1.0496 |
1.0496 |
|
26 |
1.0197 |
1.0197 |
56 |
0.9812 |
0.9813 |
|
27 |
1.0266 |
1.0366 |
57 |
1.0252 |
1.0253 |
|
28 |
1.0296 |
1.0296 |
58 |
1.0368 |
1.0369 |
|
29 |
1.0343 |
1.0349 |
59 |
1.0441 |
1.0442 |
|
30 |
1.0612 |
1.0614 |
|
|
|
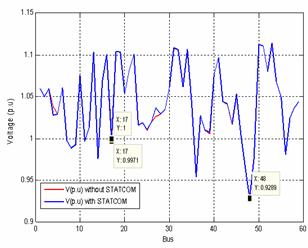
Figure 5. Location of STATCOM at bus 17
Case 2:
Table 2 and Figure 6 show the voltage before and after the STATCOM placement. According to result when STATCOM is connected at bus 48 the voltage magnitude of buses 7, 11, 47 and 48 are 1.0 p.u and voltage magnitude of buses 8, 9, 14, 49 and 56 are also improved. From the comparison of STATCOM placement between case 1 and case 2 it is obviously that location of STATCOM at the bus 48 gives a better result as the first case. We conclude that the case 2 gives a best location of STATCOM.
Table 2. Voltage results with and without STATCOM (best location)
|
Bus N° |
V (pu) without STATCOM |
V (pu) with STATCOM |
Bus N° |
V (pu) without STATCOM |
V (pu) with STATCOM |
|
1 |
1.0600 |
1.0600 |
31 |
1.1084 |
1.1182 |
|
2 |
1.0500 |
1.0500 |
32 |
1.1066 |
1.1161 |
|
3 |
1.0600 |
1.0600 |
33 |
1.10621 |
1.0911 |
|
4 |
1.0383 |
1.0283 |
34 |
1.1062 |
1.1164 |
|
5 |
1.0297 |
1.0310 |
35 |
1.0404 |
1.0700 |
|
6 |
1.0605 |
1.0635 |
36 |
1.0273 |
0.9629 |
|
7 |
0.9975 |
1.0000 |
37 |
1.0273 |
1.0273 |
|
8 |
0.9886 |
0.9906 |
38 |
1.0099 |
1.0104 |
|
9 |
0.9927 |
0.9943 |
39 |
1.0057 |
1.0076 |
|
10 |
1.0751 |
1.0751 |
40 |
1.0767 |
1.0767 |
|
11 |
0.9970 |
1.0071 |
41 |
1.0966 |
1.0966 |
|
12 |
1.0142 |
1.0188 |
42 |
1.0440 |
1.0440 |
|
13 |
1.1034 |
1.1100 |
43 |
1.0416 |
1.0494 |
|
14 |
0.9758 |
0.9776 |
44 |
1.0171 |
1.0182 |
|
15 |
1.0689 |
1.0778 |
45 |
1.0527 |
1.0538 |
|
16 |
1.1004 |
1.1103 |
46 |
1.0052 |
1.0060 |
|
17 |
0.9971 |
0.9988 |
47 |
0.9654 |
1.0060 |
|
18 |
1.1046 |
1.1125 |
48 |
0.9289 |
1.0000 |
|
19 |
1.1036 |
1.1119 |
49 |
0.9768 |
0.9779 |
|
20 |
1.0537 |
1.0557 |
50 |
1.1122 |
1.1213 |
|
21 |
1.0815 |
1.0875 |
51 |
1.1114 |
1.1199 |
|
22 |
1.1004 |
1.1080 |
52 |
1.0805 |
1.0889 |
|
23 |
1.0162 |
1.0165 |
53 |
1.1139 |
1.1227 |
|
24 |
1.0194 |
1.0199 |
54 |
1.0679 |
1.0757 |
|
25 |
1.0105 |
1.0126 |
55 |
1.0496 |
1.0500 |
|
26 |
1.0197 |
1.0126 |
56 |
0.9812 |
0.9824 |
|
27 |
1.0266 |
1.0366 |
57 |
1.0252 |
1.0258 |
|
28 |
1.0296 |
1.0366 |
58 |
1.0368 |
1.0370 |
|
29 |
1.0343 |
1.0366 |
59 |
1.0441 |
1.0444 |
|
30 |
1.0612 |
1.0637 |
|
|
|
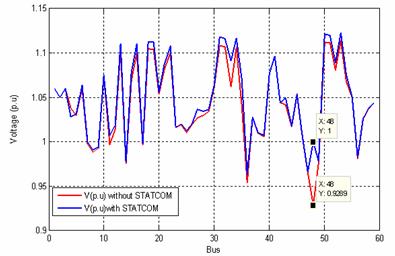
Figure 6. Location of STATCOM at bus 48
Conclusion
In this study, a steady-state model of STATCOM for power flow solution was developed for desired power transferred and bus voltage profile improvement. Then the proposed models and algorithm were implemented on 59-bus system. The obtained results show clearly the best emplacement of STATCOM in improving voltage regulation in the Algerian network.
References
1. Mithulananthan N., Cañizares C.A. and Reeve J., Comparison of PSS, SVC and STATCOM Controllers for Damping Power System Oscillation, IEEE Transactions Power Systems, 2003 18(2), p. 786-792.
2. Cai L.J., Erlich I., Stamtsis G., Optimal Choice and Allocation of FACTS Devices in Deregulated Electricity Market Using Genetic Algorithms, IEEE/PES Power Systems Conference and Exposition, October, 2004, 1, p. 201-207.
3. Reddy S.S., Kumari M.S., Sydulu M., Congestion Management in Deregulated Power System by Optimal Choice and Allocation of FACTS Controllers Using Multi-Objective Genetic Algorithm, Journal of Electrical Engineering and Technology, 2009, 4(4), p. 467- 475.
4. Chandrakar V.K., Kothari. A.G., Comparison of RBFN based STATCOM, SSSC and UPFC Controllers for Tran-sient Stability Improvement, Power Systems Conference and Exposition, PSCE, IEEE/PES, 2006(6), p. 784-791.
5. Mohammad H.M., Anita R., The Study of Dynamic Performance of Wind Farms with the Application Trends in Engineering, International Journal of Recent Trends in Engineering, 2009, 2, p. 158-160.
6. Chauhan S., Chopra V., Singh S., Transient Stability Improvement of Two Machine System using Fuzzy Controlled STATCOM, International Journal of Innovative Technology and Exploring Engineering, 2013, 2, p. 52-56.
7. Li H., Chen Z., Overview of Different Wind Generator Systems and their Comparisons, IET, Renewable Power Generation, 2008, 2, p. 123-138.
8. Zhang L., Xiao D., Zhang D., Proving the Controllability for Arbitrary Operating Point of STATCOM, 7th WSEAS International Conference on Mathematical Methods and Computational Techniques in Electrical Engineering, Sofia, 2008, 27-29/10/05, p. 305-309.
9. Larsen E.V., Sanchez-Gasca J.J., Chow J.H., Concept for Design of FACTS Controller to Camp Power Swings IEEE Transactions on Power Systems, 1995, 10(2), p. 948-956.
10. Kumar I.S., Flexible Alternating Current Transmission Systems: Static Synchronous Compensator (STATCOM), Bachelors. Dissertation, Curtin University of Technology, Western Australia, November, 2005.
11. Marín R.D., Detailed Analysis of a Multi-pulse STATCOM, Pre-doctoral Dissertation, Guadalajara, Jalisco, Mexico, May, 2003.
12. Uzunovic E., EMTP, Transient Stability and Power Flow Models and Control of VSC Based Facts Controllers, Ph.D. Dissertation, Waterloo University, Waterloo Ontario, Canada, 2001.
13. El-Moursi M.S., Sharaf A.M., Novel Reactive Power Controllers for the STATCOM and SSSC, IEEE Department of Electrical and Computer Engineering, University of New Brunswick, Canada, Review Electric Power System Research, 2006, p. 228-241.
14. Emmanuelle CATZ., Technical Evolution of the System FACTS, Electro Club EEA days Supelec, March, 15, 2006.
15. Shahraki E.G., Contribution of UPFC for Improving Transient Stability of Power Systems, Ph.D. Henri Poincaré University, Nancy-I Electrical Engineering Supported publicly, October, 13, 2003.
16. Patii K.V., Dynamic Compensation of Electrical Power Systems Using a new STATCOM, Ph.D. Faculty of Graduate Studies University of Western Ontario London, Ontario, March, 1999.