Impact of the wind and solar energy insertion into the electrical network
Hocine GUENTRI1*, Fatiha LAKDJA 2, Fatma Z. GHERBI3
1 Intelligent Control and Electrical
Power System Laboratory (ICEPS),
2 Intelligent Control and Electrical Power
System Laboratory (ICEPS),
3 Engineering Department. Intelligent Control and Electrical Power System Laboratory(ICEPS) Djillali Liabes University Sidi-Bel-Abbes, Algeria.
E-mail(s): 1hguentri2005@yahoo.fr ; 2flakdja@yahoo.fr; 3fzgherbi@gmail.fr
* Corresponding author, phone: 00213 661 69 31 73; fax: 00213 46 43 82 58
Abstract
A lot of attention is being paid to wind and solar energy due to the focus on renewable energy. Wind and solar resources in Algeria vary from one location to another. Wind speed and solar energy are better in terms of electricity generation, but there are many difficulties in ensuring higher quality power into the grid. In this paper, it propose an importance a study use the renewable energy insertion in the western Algerian network2012 and we will try to see the impact of this insertion to reduce the power losses in order to reduce the production of the slack bus. The choice of this study is justified by simulation in POWER WORLD.
Keywords
Wind energy; Solar; Algerian network 2012; POWER WORLD; Better sit; Power flow; Slack bus; Active losses
Introduction
Wind and solar energy have attracted world-wide attention due to the shrinkage and soaring prices of fossil fuels. With no dependency on fossil fuels and environmental friendliness, wind and solar energy are playing a major role as an attractive alternative source of energy. Wind and solar energy are considered as most suitable alternative source due to its mature and clean aspects. Wind and solar energy are the most promising and in fact world’s largest renewable energy resource among the world [1].
Thermal solar is the most common in the field of renewable energy; it sees an efficiency and sustainability of such power plant. Many concentrators, each of which have been proposed and studied recently, can be broadly categorized as reflective units and refractive units. These can also be cylindrical to focus on a line, or circular to focus on a point [2].
The emergent pace of wind and solar energy projects in various countries around the world has put wind and solar energy at the forefront of the energy destiny. Among the various renewable energy resources, wind and solar power is assumed to have the most favourable technical and economic prospects [3].
Algeria in particular and the countries of Maghreb have an elevated solar potential. The rates of solar irradiation done by satellites by the German space agency (DLR), show levels of sunshine exceptional of the order of 1200 kWh/m2/year in the North of the Big Sahara [4], this countries taking steps to develop large-scale wind and solar markets.
West Algeria has good wind and solar conditions which offer the possibility to greatly extend its current wind and solar utilization.
This work described a study of the impact of the insertion of renewable energy in the Algerian western network 2012, 220Kv. The principal goal was to achieve improved quality of voltage and decreases the power losses by the insertion of wind and solar power with the use of a powerful tool for simulation which is Power world.
Material and method
Model of the wind turbine
Wind speed v, applied to the blades of the wind turbine, involve its setting in rotation and creates a mechanical power on the turbine shaft, noted Pt and expressing by [5-7].
where λ is defined by:
The power coefficient CP represents the aerodynamic output of the wind turbine and also depends on the characteristic of the turbine. This coefficient presents a theoretical limit, called limit of Betz, equal to 0.593 and which is never reached in practice.
In this paper, it will use an approximate expression of the coefficient of power according to relative speed λ and of the pitch angle β whose expression originates [8-10].
Knowing the number of revolutions of the turbine, the torque Ct available on the slow tree of the turbine can thus be expressed by [11]:
Model of the solar power
Solar radiation is a high-temperature and high energy source that may be exploited by using concentrating solar systems which transform solar energy into another type of energy (usually thermal). Solar concentrating systems are classified by their focus geometry as either point-focus concentrators (central receiver systems and parabolic dishes) or line-focus concentrators (parabolic- trough collectors (PTCs) and linear Fresnel collectors) [12].
Concentrator solar power consists of three types of technology: power tower, parabolic trough, and parabolic dish shown in Figure 1. It focused on the power tower and parabolic trough technologies, both of which are now capable of being developed as large-scale power generating facilities (troughs> 100MW and towers >15MW) [13,14].
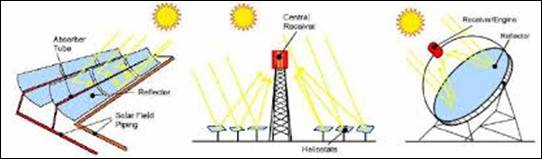
Figure 1. Dishes, towers, troughs and fresnel linear
Solar fields using
trough systems capture the sun’s energy using large mirrors shaped like a
parabola, or a giant “U,” that are connected together in long lines that track
the sun’s movement throughout the day. When the sun’s heat is reflected off the
mirror, the curved shape sends most of that reflected heat onto a receiver pipe
that is filled with a specialized heat transfer fluid. The thermal energy from
the heated fluid generates steam and electricity in a conventional steam
turbine. Once the fluid transfers its heat, it is recalculated into the system
for reuse. The steam is also cooled, condensed, and reused. Heated fluid in
trough systems can also provide heat to thermal storage systems, which can be
used to generate electricity at times when the sun is not shining Figure 2
[15-18].
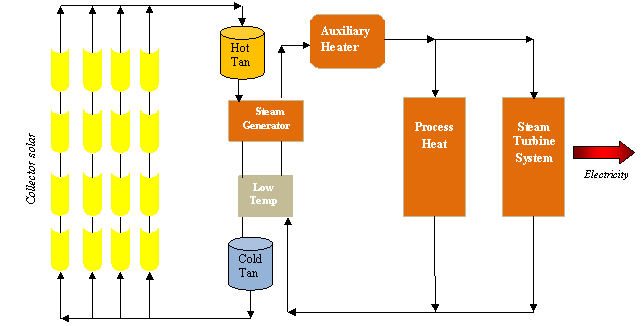

Figure 2. Plant Description
Algerian wind potential
12 identified zones (3 coastal, 4 in the central area and 5 in the south), set out again on a total surface of 906 200 km2 in a twenty Wilaya.
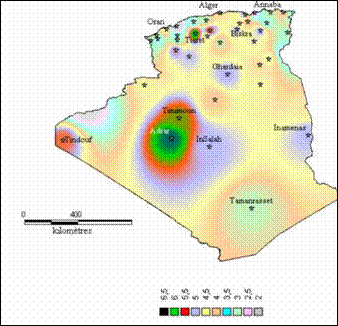
Figure 3. The area windy in Algeria
For establishing a wind power turbine, a site should be chosen where the speed of the wind would provide the necessary energy; thus there should be made speed measurements of the wind in several sites. Figure 4 show an example of the areas which have been windy in Algeria according to the satellite data of the Laboratory of Wind energy CDER in 2011 [19].
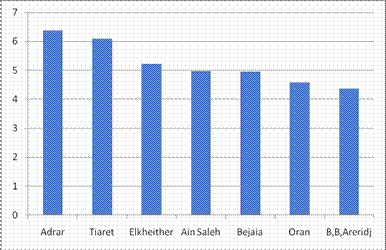
Figure 4. Comparison between the average speeds of windy sites
Algerian solar potential
By its geographical situation, Algeria has huge solar potential especially in the south. Sunshine duration on almost all the national territory exceeds 2,000 hours annually and can reach 3900 hours [20,21].
Application
The principal goal of this article was presented by a test to formulate a model of the western network Algerian 2012 in power world.
In this model, all the power stations used in this area for the production of electrical energy were included, as well as simulations were illustrated by the use of one of the most recent software Power World. This last was applied for such systems complicated without any failure or instability in simulation.
Power world is a very convivial tool for the users of computing and planning system for power systems, for their dynamic simulation.
The network represented by the figure (6) includes:
· 21 bus;
· 05 production bus;
· 02 compensation bus;
· 15 consummation bus;
· 31 lines.
The calculation of the power flow is a stage necessary to be able to compare our results. It is performed first for the determination of the initial conditions of the system before the insertion of the renewable energy. Indeed, it makes it possible to find the voltages in the different nodes and subsequently transmitted powers injected and losses.
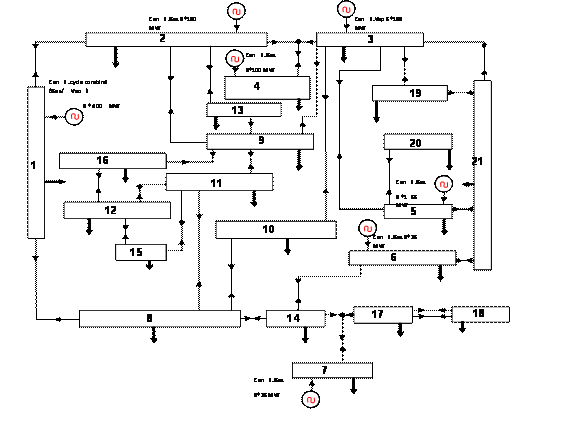
Figure 6. West-Algerian network (2012)
Results and Discussion
Problematic of the network West-Algeria
According to the results of the power flow proceeding as indicated in Table 1 and 2, we can conclude that this network contains two problems, the first it is the power transit especially in the longest lines such as Bechar-Naama and Naama- Saida, the second problem it is the greatest quantity of the active losses. Then it is necessary to solve this problem using the renewable energy. Then we must insert a wind and solar power in the network West-Algeria, but when we will install this device? Which are the parameters of adjustment of this device?
Table 1. Power flow of the western Algerian network
|
Bus N° |
Voltage (pu) |
Voltage (Kv) |
Angle (Deg) |
Load (MW) |
Load (Mvar) |
Gen (MW) |
Gen (Mvar) |
|
1 |
1 |
220 |
0 |
0 |
0 |
193.92 |
-3.88 |
|
2 |
1 |
220 |
0.94 |
27.47 |
12.82 |
328 |
19.63 |
|
3 |
1 |
220 |
0.42 |
0 |
0 |
290 |
21.31 |
|
4 |
1 |
220 |
0.49 |
0 |
0 |
0 |
-0.78 |
|
5 |
1 |
220 |
-3.57 |
127 |
0 |
120 |
55.1 |
|
6 |
1 |
220 |
-2.24 |
122.31 |
65.18 |
212 |
72.21 |
|
7 |
1 |
220.001 |
-7.83 |
0 |
0 |
0 |
49.02 |
|
8 |
0.9973 |
219.405 |
-0.95 |
0 |
0 |
0 |
0 |
|
9 |
0.9921 |
218.25 |
-0.05 |
51 |
16 |
0 |
0 |
|
10 |
0.9913 |
218.088 |
-1.25 |
93.85 |
43.83 |
0 |
0 |
|
11 |
0.977 |
214.934 |
-2.28 |
77.33 |
32.89 |
0 |
0 |
|
12 |
0.9714 |
213.702 |
-2.67 |
10 |
5 |
0 |
0 |
|
13 |
0.9962 |
219.169 |
0.49 |
37.66 |
17.58 |
0 |
0 |
|
14 |
0.9963 |
219.18 |
-4.17 |
120 |
6 |
0 |
0 |
|
15 |
0.9741 |
214.297 |
-2.52 |
0 |
0 |
0 |
0 |
|
16 |
0.9656 |
212.436 |
-2.96 |
93.38 |
46.85 |
0 |
0 |
|
17 |
0.9996 |
219.906 |
-7.85 |
51.67 |
44.84 |
0 |
0 |
|
18 |
0.9865 |
217.022 |
-10.67 |
20.64 |
8.73 |
0 |
0 |
|
19 |
0.987 |
217.147 |
-1.45 |
61.78 |
18.9 |
0 |
0 |
|
20 |
0.9851 |
216.719 |
-4.8 |
40.16 |
18.74 |
0 |
0 |
|
21 |
0.9794 |
215.465 |
-4.32 |
197 |
37.7 |
0 |
0 |
|
TOTAL |
1131.3 |
375.06 |
1143.9 |
212.61 |
|||
Table 2. Power flow in the western Algerian network
|
From Number |
To Number |
Pflow (MW) |
Qflow (Mvar) |
Ploss (MW) |
Qloss |
|
2 |
1 |
82.6 |
-21.1 |
0.12 |
-27.26 |
|
8 |
1 |
-276 |
-32.5 |
0.46 |
-30.21 |
|
2 |
3 |
3.7 |
-1 |
0 |
-1.92 |
|
2 |
4 |
34.5 |
-9.3 |
0.07 |
-1.41 |
|
9 |
2 |
-97.3 |
-18.2 |
0.46 |
0.41 |
|
13 |
2 |
-81.8 |
-20.4 |
0.15 |
-0.69 |
|
3 |
4 |
-34.5 |
8.5 |
0.01 |
-0.22 |
|
3 |
5 |
80.4 |
-17.3 |
1.39 |
5.29 |
|
3 |
9 |
28.6 |
14.4 |
0.09 |
-4.73 |
|
3 |
10 |
45.7 |
0.3 |
0.34 |
-3.59 |
|
3 |
19 |
103.2 |
14.6 |
0.88 |
1.05 |
|
3 |
21 |
70.2 |
1.7 |
1.45 |
3.28 |
|
20 |
5 |
-40.2 |
-18.7 |
0.24 |
-3.03 |
|
5 |
21 |
31.6 |
16.8 |
0.41 |
-4.02 |
|
6 |
14 |
32.2 |
-7.8 |
0.27 |
-6.8 |
|
6 |
21 |
57.5 |
14.8 |
0.6 |
-2.68 |
|
7 |
14 |
-36.3 |
6.4 |
0.6 |
-10.09 |
|
17 |
7 |
-36.3 |
-42.7 |
0.01 |
-0.03 |
|
10 |
8 |
-48.5 |
-39.9 |
0.1 |
-6.61 |
|
11 |
8 |
-63.2 |
-37.7 |
0.47 |
-3.59 |
|
8 |
14 |
163.7 |
-35 |
1.88 |
-9.23 |
|
9 |
11 |
41.1 |
-1.8 |
0.57 |
-5.99 |
|
13 |
9 |
44.2 |
2.8 |
0.15 |
-1.36 |
|
9 |
16 |
77.7 |
27.3 |
0.61 |
-3.23 |
|
11 |
12 |
15.9 |
6.3 |
0.04 |
-3.22 |
|
15 |
11 |
-10.5 |
-5.7 |
0.01 |
-3 |
|
12 |
15 |
-10.5 |
-7.7 |
0.01 |
-2.03 |
|
16 |
12 |
-16.3 |
-16.3 |
0.02 |
-4.01 |
|
14 |
17 |
36.9 |
-16.2 |
0.6 |
-10.16 |
|
17 |
18 |
20.9 |
-8.2 |
0.26 |
-16.96 |
|
19 |
21 |
40.6 |
-5.4 |
0.42 |
-6.39 |
|
TOTAL |
12.69 |
-162.4 |
|||
The emplacement of the devices
The emplacement of the wind and solar power are conditioned by two criteria first is internal related to the problems of this network, and the second related to the climatic condition of the area where we go installed this device.
According to the study of the power flow of the western network Algerian 2012 without the insertion of the renewable energy and as the study of the areas been solar and windy in Algeria, we can say as the ideal site of those devices are on the level of the area of Tiaret or the speed of the wind to reach 6.78 m/s during the month April 2011, and also Naama, for the solar power the ideal site is in Bechar as shown in Figure 7.
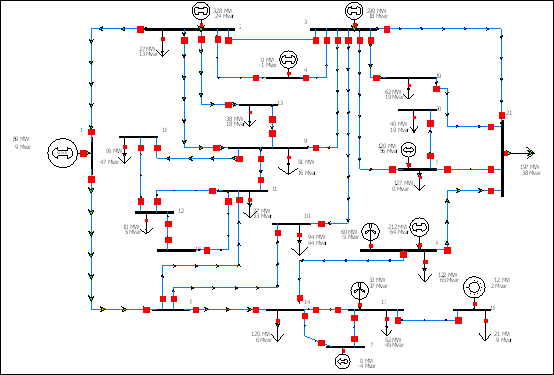
Figure 7. West-Algeria (2012) network with renewable energy
The calculation of the power flow of the system with insertion of devices in the sits chosen, the results obtained are in Table 3 and 4.
Table 3. Power flow of the western Algerian network (2012) with insertion of the renewable energy
|
Bus N° |
Voltage (pu) |
Voltage (Kv) |
Angle (Deg) |
Load (MW) |
Load (Mvar) |
Gen (MW) |
Gen (Mvar) |
|
1 |
1 |
220 |
0 |
0 |
0 |
89.44 |
8.67 |
|
2 |
1 |
220 |
1.26 |
27.47 |
12.82 |
328 |
24.13 |
|
3 |
1 |
220 |
1 |
0 |
0 |
290 |
18.36 |
|
4 |
1 |
220 |
1.04 |
0 |
0 |
0 |
-0.92 |
|
5 |
1 |
220 |
-2.43 |
127 |
0 |
120 |
56.06 |
|
6 |
1 |
220 |
0.84 |
122.31 |
65.18 |
272 |
59.31 |
|
7 |
1 |
220 |
-4.12 |
0 |
0 |
0 |
-3.92 |
|
8 |
1.00 |
219.37 |
-0.68 |
0 |
0 |
0 |
0 |
|
9 |
0.99 |
218.25 |
0.33 |
51 |
16 |
0 |
0 |
|
10 |
0.99 |
218.04 |
-0.93 |
93.85 |
43.83 |
0 |
0 |
|
11 |
0.98 |
214.9 |
-1.97 |
77.33 |
32.89 |
0 |
0 |
|
12 |
0.97 |
213.68 |
-2.34 |
10 |
5 |
0 |
0 |
|
13 |
1.00 |
219.16 |
0.82 |
37.66 |
17.58 |
0 |
0 |
|
14 |
1.00 |
219.21 |
-2.57 |
120 |
6 |
0 |
0 |
|
15 |
0.97 |
214.27 |
-2.2 |
0 |
0 |
0 |
0 |
|
16 |
0.97 |
212.42 |
-2.62 |
93.38 |
46.85 |
0 |
0 |
|
17 |
1.00 |
220 |
-4.13 |
51.67 |
44.84 |
30 |
37.42 |
|
18 |
1.00 |
220 |
-5.37 |
20.64 |
8.73 |
12 |
1.87 |
|
19 |
0.99 |
217.25 |
-0.65 |
61.78 |
18.9 |
0 |
0 |
|
20 |
0.99 |
216.72 |
-3.66 |
40.16 |
18.74 |
0 |
0 |
|
21 |
0.98 |
215.58 |
-2.73 |
197 |
37.7 |
0 |
0 |
|
|
1131.25 |
375.1 |
1141.4 |
200.98 |
|||
Table 4. Transit of power in the western Algerian network (2012) with insertion of the renewable energy
|
From Number |
To Number |
Pflow (MW) |
Qflow (Mvar) |
Ploss (MW) |
Qloss |
|
2 |
1 |
110.4 |
-23.1 |
0.22 |
-26.19 |
|
8 |
1 |
-199.4 |
-44.1 |
0.24 |
-32.37 |
|
2 |
3 |
1.8 |
-1 |
0 |
-1.94 |
|
2 |
4 |
17 |
-5.1 |
0.02 |
-1.62 |
|
9 |
2 |
-91.9 |
-19.7 |
0.41 |
0.23 |
|
13 |
2 |
-78.8 |
-21.3 |
0.14 |
-0.73 |
|
3 |
4 |
-17 |
4.1 |
0 |
-0.25 |
|
3 |
5 |
69.1 |
-15.2 |
1.03 |
3.85 |
|
3 |
9 |
38.9 |
12 |
0.14 |
-4.53 |
|
3 |
19 |
92.2 |
15.6 |
0.71 |
0.36 |
|
3 |
21 |
56 |
3.7 |
0.93 |
1.21 |
|
20 |
5 |
-40.2 |
-18.7 |
0.24 |
-3.03 |
|
5 |
21 |
20.7 |
21.3 |
0.29 |
-4.25 |
|
6 |
14 |
56.2 |
-12.7 |
0.82 |
-4.58 |
|
6 |
21 |
93.5 |
6.9 |
1.48 |
0.82 |
|
7 |
14 |
-15.2 |
0 |
0.11 |
-12.04 |
|
17 |
7 |
-15.2 |
3.8 |
0 |
-0.06 |
|
10 |
8 |
-41.7 |
-41.5 |
0.08 |
-6.67 |
|
11 |
8 |
-61.3 |
-38.1 |
0.45 |
-3.68 |
|
8 |
14 |
95.8 |
-25.1 |
0.65 |
-15.23 |
|
9 |
11 |
42.2 |
-2 |
0.6 |
-5.9 |
|
13 |
9 |
41.2 |
3.8 |
0.13 |
-1.42 |
|
9 |
16 |
78.5 |
27.3 |
0.62 |
-3.14 |
|
11 |
12 |
15.4 |
6.4 |
0.04 |
-3.22 |
|
15 |
11 |
-10.1 |
-5.7 |
0.01 |
-3 |
|
12 |
15 |
-10.1 |
-7.8 |
0.01 |
-2.03 |
|
16 |
12 |
-15.5 |
-16.4 |
0.02 |
-4.02 |
|
14 |
17 |
15.3 |
-12 |
0.11 |
-12.11 |
|
17 |
18 |
8.7 |
-11.2 |
0.05 |
-18.05 |
|
19 |
21 |
29.7 |
-3.6 |
0.23 |
-7.34 |
|
|
10.22 |
-174.09 |
|||
According to the results obtained in Table 5, total losses of the system decreased by 12.69 MW to 10.22 MW, resulting in a profit of 2.47 MW. This reduction is obtained thanks to the site of devices wind and solar in the buses 6, 17 and 18.
Table 5. Results comparison
|
Results |
Without renewable energy |
With renewable energy |
Better emplacement |
|
Active losses [MW] |
12.69 |
10.22 |
Wind (Tiaret, Naam) Solar (Bechar) |
|
Production of Slak bus [WM] |
193.92 |
89.44 |
Wind (Tiaret, Naam) Solar (Bechar) |
In addition, it is noticed that the production of slack bus is reduce from 193.92 MW to 89.44 MW, we can won 104.48 MW from the fossil production and equilibrium by the use of the renewable energy.
This work was devoted to the integration of wind and solar, the application of the proposed approach on the real network (the west-Algerian network 2012) yields better results. The results obtained show that the wind and solar can play a very important part in the field of the reduction of the active losses in the electric lines and to decrease the production of slack bus
References
1. Bayar T., World Wind Market: Record Installations, But Growth Rates Still Falling [online] [accessed February 2012]. Available at: http://www.renewableenergyworld.com/rea/news/article/2011/08/world-wind-market-record-installations-but-growth-rates-still-falling
2. Gama A., Malek A., Optical and Thermal Comparison Between Ordinary and Mirror Blades Reflector for Solar Parabolic Trough collector, 4th International Conference on Power Engineering, Energy and Electrical Drives, 13-17 May 2013 Istanbul, Turkey.
3. Heier S., Grid Integration of Wind Energy Conversion Systems, Chichester, 2006, U.K.: John Wiley and Sons LTD.
4. Wagner H. J., Energy Technologies, Subvolume C , Renewable Energy.
5. Xianyun Li., Xiaohu C., Guoqing T., Simulative study on steadystate performance of DFIG, Electric Power Automation Equipment, 2005, 25, p. 69.
6. Hangye Y., The control technique of the wind power, Bejin: China Machine Press, 2002.
7. Zhao L., Jinchun S., Hongyi L., Simulation study of wind power with continuously variable transmission, second IEEE conference on industrial electronics and applications, 2007, pp. 2603-2605.
8. Belfedal C., Moreau S., Champenois G., Allaoui T., Dennai M., Comparison of PI and Direct Power Control with SVM of Doubly Fed Induction Generator, Journal of Electrical and Electronics Engineering, 2008, 8(2). p. 633-641.
9. Rahimi M., Parniani M., Dynamic behavior analysis of doubly-fed induction generator wind turbines, The influence of rotor and speed controller parameters, International Journal of Electrical Power and Energy Systems, 2010, 32(5), p. 464–477.
10. Ben Alaya J., Khedher A., Mimouni M. F., Steady-State Analysis of DFIG for Wind Power Generation System Drive, International Journal of Energy, 2012, 6(4), p. 123-132.
11. Babaie L. A., Asghar G. S., Shahabi M., Modelling and Control of a DFIG-Based Wind Turbine During a Grid Voltage Drop, Engineering Technology & Applied Science Research, 2011, 1(5), p. 121-125.
12. Brechlin U., Hot potential: Development of solar thermal markets in Europe, Refocus, 2005, 6, p. 52-56.
13. Soteris A. K., Solar thermal collectors and applications, Progress in Energy and Combustion Science, 2004, 30, p. 231-295.
14. Powell K. M., Edgar T. F., Modeling and control of a solar thermal power plant with thermal energy storage, Chemical Engineering Science, 2012, 71, p. 138-145.
15. Escobar-Romer J., Vázquez Y. M., Granados-Agustín F., Building a parabolic solar concentrator prototype, IOP Publishing. Journal of Physics, 2011 Conference Series, pp. 274.
16. Scott L., Dale S. D., Katie Z., Forrest R., Taufik T., A Low Cost Portable Parabolic Solar Concentrator for Combined Heat and Power, Proceeding of the North American Power Symposium (NAPS), 2012, p. 1-6.
17. Hinkley J., Curtin B., Hayward J., Wonhas A., Concentrating solar power - drivers and opportunities for cost-competitive electricity, CSIRO Energy Transformed Flagship, 2011,
18. Gonzalez F. A., Liberali R., Concentrating solar power from research to implementation, European commission, 2007, pp. 14.
19. Kaspadji N., Merzouk M., Perspectives du pompage éolien en Algérie, Projet National de recherche, domicilié au CDER , 2008.
20. Gourieres D. L., Eolienne : Théorie conception et calculs pratiques des installations, Edition: Evrolles, Energie, 2012.
21. Malika D., Pompage de l'eau à l'aide de l'énergie éolienne au service des zones rurales, Magister thesis, Telemcen university, 2008. Algeria.