The sensitivity approach method with optimal placement of thyristor controlled series compensator
Messaoud. ZOBEIDI1,*, Fatiha LAKDJA2 and Fatima Zohra GHERBI1
1Engineering Department. Intelligent Control and Electrical Power System Laboratory (ICEPS), Djillali Liabes University, Sidi-Bel-Abbes, 22000, Algeria
2The Department of Electrical Engineering, Saida University, Engineering Department. Intelligent Control and Electrical Power System Laboratory (ICEPS), Djillali Liabes University, Sidi-Bel-Abbes, 22000, Algeria.
E-mails: Messoud91@yahoo.fr; flakdja@yahoo.fr; fzgherbi@gmail.com
* Corresponding author, phone: +213664789057
Abstract
The stressed power system, due to the increased loading or severe contingencies leads to situation where the system no longer remains in the secure operating region. The Flexible AC Transmission System (FACTS) can improve the power system transmission network operation. In order to undue costs, optimal placement of the devices FACTS in the power system must be located. The main objective of this manuscript is to locate the optimal placement of the TCSC devices (Thyristor Controlled Series Compensator), using the reactive power loss sensitivity index based approach and LODF (Line Outage Distribution Factor). The method proposed as testing in two different systems of IEEE 6 bus and IEEE 25 bus is modified using Power world simulator software version 18.
Keywords
Line outage distribution factor; Reactive power loss sensitivity index; Flexible
AC Transmission System; Thyristor Controlled Series Compensator
Introduction
During the last years, the power system, included problems related to the increased loading or severe contingencies, has lead to situations where the system no longer remains in the secure operating region. The principal objective of the operators is to improve power system security with different levels of difficulty [1].
The security of a power system can be defined as its ability to withstand a set of severe but credible contingencies and to survive transition to an acceptable new steady state condition. In contrast, the insecure cases represent grave threats to the operation of the system [2-3].
The Flexible AC Transmission systems (FACTS) controllers can be help to improve system safety by effectively controlling the line power flows (to reduce the transmission congestion, resulting in an increased loadability) [4-5]. It is defined by the IEEE (Institute of Electrical and Electronics Engineers) as a power electronic based system and other static equipment that provide control of one or more AC transmission system parameters to enhance controllability and increase power transfer capability [6]. The FACTS devices have high cost so it is necessary for optimal placement in the power system.
Several papers interested to treat with different methods the optimal location of FACTS controllers. Which have presented the method of optimal location of TCSC, TCPAR and UPFC [2-3]. In this paper, the reduction of total system reactive power losses and the line outage distribution factor method used for determined optimal location of series FACTS device (TCSC).
The reduction of total system reactive power losses method is suggested to find optimal placement of FACTS devices, this method based on the sensitivity of the total system reactive power loss with respect to the control variable of the FACTS [7-9]. The line outage distribution factor used again for decide optimal for one only case in the line outage .The LODF says how the flow changes on a line when there is other line outage in the power system [10].
The aim of this study was to test the methods suggested on two different systems of IEEE 6 bus and IEEE 25 bus is modified using Power world simulator software version 18.
Material and method
Modeling of the series FACTS device TCSC
The TCSC consists of an inductance in series with a thyristor valve, shunted by capacitor, this unit is inserted in series on the line of transmission and the figure 1 shows the basic structure of TCSC:
Figure 1. Thyristor controlled series capacitor
Model of injection
Figure 2 shows a model of line with TCSC connected between tows buses i and j. TCSC is equivalent a static reactance -jxc, This controllable reactance is directly used the control variable in the power flow equations .
Let complex voltages at bus-i
and bus-j are ![]() and
and ![]() respectively.
respectively.
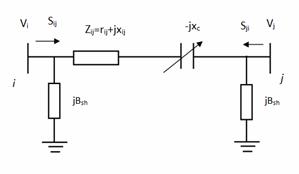
Figure 2. Transmission line with TCSC model
The real and reactive power flow equations at bus i and bus j with a new line reactance given as follows:
|
|
(1) |
|
|
(2) |
|
|
(3) |
|
|
(4) |
Hence, the change in the line flows due to series capacitance, the real and reactive power flows injection at bus i and bus j:
|
|
(5) |
|
|
(6) |
|
|
(7) |
|
|
(8) |
The reactive power loss on each line can be formulated as:
|
QL = Qij + Qji |
(9) |
|
|
(10) |
where:![]() ,
, ,
, ![]() ,
, ![]() , Vi , Vj
: The voltage magnitude at bus i and j, δij : The voltage
angle difference between bus i and j (δi-δj), xc
: TCSC capacitive reactance (TCSC is equivalent a static capacitive reactance),
xij : The reactance of Transmission line between bus i and j, rij
: The resistance of Transmission line between bus i and j, Gij: The
susceptance of Transmission line between bus i and j with TCSC, Bij:
The conductance of Transmission line between bus i and j with TCSC, Bsh:
Shunt susceptance at line i-j, ∆Gij: (Gline-Gij)The
change of Transmission line Susceptance, ∆Bij: (Bline-Bij)
Transmission line Susceptance, Pijc: is the real power
transfer from bus i to bus j with TCSC, Pic, Pjc:
the real power injections at bus i and j, Qijc: is the
reactive power transfer from bus i to bus j with TCSC, Qic,
Qjc: the reactive power injections at bus i and j, QL:
The reactive power loss on the line i-j
, Vi , Vj
: The voltage magnitude at bus i and j, δij : The voltage
angle difference between bus i and j (δi-δj), xc
: TCSC capacitive reactance (TCSC is equivalent a static capacitive reactance),
xij : The reactance of Transmission line between bus i and j, rij
: The resistance of Transmission line between bus i and j, Gij: The
susceptance of Transmission line between bus i and j with TCSC, Bij:
The conductance of Transmission line between bus i and j with TCSC, Bsh:
Shunt susceptance at line i-j, ∆Gij: (Gline-Gij)The
change of Transmission line Susceptance, ∆Bij: (Bline-Bij)
Transmission line Susceptance, Pijc: is the real power
transfer from bus i to bus j with TCSC, Pic, Pjc:
the real power injections at bus i and j, Qijc: is the
reactive power transfer from bus i to bus j with TCSC, Qic,
Qjc: the reactive power injections at bus i and j, QL:
The reactive power loss on the line i-j
Method for optimal placement of TCSC
Sensitivity approach method
This method based on the sensitivity of the total system reactive power loss with respect to the control variables of the TCSC devices. We controlled the parameter of the reactance line for TCSC located between two buses i and j. Loss sensitivity with respect to control parameter of TCSC placed between buses i and j can be giving as [5]:
|
|
(11) |

Application
In this example, the Sensitivity approach method for optimal placement of TCSC has been tested on IEEE 6 bus system by using power world simulator software 18,such as, the system consists 3 generators and 3 loads and 8 transmission lines. It shows by figure 3 when the system without TCSC.
Figure 3. IEEE 6 bus system modified
In the Figure 3, the lines 2-6, 2-5 and 3-6 have most percentage load ability values 97%, 87% and 86% respectively, caused by the increased loading.
The obtained results shown on ‘Results and discussion’ section
Line outage distribution factor
This method proposed for the optimal site of facts series TCSC, in power system. The line outage distribution factor (LODF) is important linear sensitivity factor, which is based on simplifying the nonlinear power flow equations in to a linear system using the DC assumption. LODFs are used to approximate change in the flow on one line due to the outage of another line, the line outage distribution factor says how the flow changes on a line when there is other line outage in the power system. The definition of the LODF can be giving as it is the change in flow on a line as a percentage of the pre outage flow on another line [10 -11].
|
|
(12) |
where LODF(k,m) : is the line outage distribution factor of branch k with respect to outage branch m; ∆P (k,m) : The change of the active power between two lines; Pm: The power flow after the outage of line m.
The criteria for optimal location of TCSC
The TCSC should be place in the line have most positive the reactive power loss sensitivity factors [9].
The TCSC should be place in the line have most positive factors Line outage distribution factor [10].
Results and discussion
IEEE 6 bus system modified
The reduction of total system reactive power losses method used to find optimal placement of TCSC on modified IEEE 6 bus system, the results obtained as show in Table 1.
Table 1. Sensitivity index of modified IEEE 6 bus system
|
Line |
Sensitivity index |
Line |
Sensitivity index |
|
1-5 |
-0.7 |
2-5 |
-29.7 |
|
6-5 |
-1.1 |
2-1 |
-40.4 |
|
2-3 |
-2.7 |
1-4 |
-43.1 |
|
4-5 |
-4.2 |
2-6 |
-57.7 |
|
3-5 |
-15.0 |
3-6 |
-236.6 |
|
2-4 |
-18.1 |
|
|
According to the results obtained in Table 1, it can be seen that the most positive value the sensibility index in the line (1-5).This line selected for installing of TCSC.
Figure 4. IEEE 6 bus system modified with TCSC placed in the line 1-5
The figure 4 shows the transmission network system after placing TCSC in line 1 – 5.we notice the loading of lines 2-5, 2-6 ,3-6 decrease, from 87 % to 68% , from 97% to 86% , from 86% to 84% respectively.
Table 2. The power flow with and without TCSC
|
Line |
Bus from-Bus To |
Without TCSC |
With TCSC |
|
1 |
1-5 |
36.7 |
63.1 |
|
2 |
1-4 |
43.4 |
31.4 |
|
3 |
2-5 |
11.8 |
3.7 |
|
4 |
2-1 |
27.1 |
14.0 |
|
5 |
2-3 |
2.9 |
1.9 |
|
6 |
2-6 |
27.7 |
22.4 |
|
7 |
2-4 |
34.8 |
39.8 |
|
8 |
3-6 |
43.6 |
44.1 |
|
9 |
3-5 |
19.3 |
14.0 |
|
10 |
4-5 |
5.2 |
1.4 |
|
11 |
5-6 |
0.6 |
5.1 |
The table 2 indicates that the power flow before and after sitting the TCSC, which represents by the graph (figure 5), it’s can be seen good results for the power flow ( balanced distribution of power flow )
Figure 5. The power flow with and without TCSC
IEEE 25 bus system modified
In this transmission network system, it used the line outage distribution factor method to find the optimal location of TCSC, The critical line outages were computed by line outage distribution factor for a single line outage case. Modified IEEE 25 bus system with line (5-17) outage shows in Figure 6 and 7.
Figure 6. IEEE 25 bus system modified without open the line 17-5
In the figure 7, it is observed that the line (19-5) is overloaded when the line 5-17 is opened.
Table 3. LODF % of the 25 bus system
|
Line |
LODF % |
|
5-10 |
100 |
|
1-19 |
30.8 |
|
8-7 |
25.4 |
|
4-19 |
19.4 |
According to the results obtained in Table 3, it can be seen that the most positive value the sensibility index in the line (1-5).This line is selected for installing of TCSC.
The figure 8 shows the system with TCSC placed in line (5-10), the overloading of the line (5-19) decreases from 107% to 95% and the line (19-4), from 89% to 79%.
Figure 7. IEEE 25 bus system modified with line (5-17) is open

Figure 8. IEEE 25 bus system modified with TCSC in line 5-10
In Figure 9, The TCSC placed in the line (1-19), the lines (1-19) and (5-19) are load ability with limit 103% and 112%.
Form figure 10, we can see stressed power system.
In figure 11, the TCSC placed in line (4-19), and the loading of line (1-2) increases from 108% .This line is not optimal placement for improvement the power system security.
Figure 9. IEEE 25 bus system modified with placed TCSC in (1-19)

Figure 10. IEEE 25 bus system modified with TCSC in (7-8)
Conclusion
The optimal placement of TCSC is important for improving the security of power system, the method which are suggested sensitivity based approach and line outage distribution factor .The results obtained was tested on modified IEEE 6 bus and modified IEEE 25 bus systems , where the lines (1-5) and (5-10) are the optimal location respectively.
References
1. Sayyed A. N. L., Gadge P. M. , Sheikh R. U., Contingency analysis and improvement of power system security by locating series FACTS devices TCSC and TCPAR at optimal location, IOSR-JEEE, International Conference on Advances in Engineering & Technology, 2014, 2, p. 19-27.
2. Singh S. N, Location of FACTS devices for enhancing power systems’ security, 1st Large Engineering Systems Conference On Power Engineering LESCOPE’01, 2001, p. 162-166.
3. Singh J. G., Singh S. N., Srivastava S. C., Enhancement of power system security through optimal placement of TCSC and UPFC, Power Engineering Society General Meeting, IEEE, 2007.
4. Navani J. P., Goyal M., Sapra S., Optimal placement of TCSC and UPFC for enhancement of steady state security in power system, International Journal of Advances in Engineering Science and Technology, 2012, 1(2), p. 122-129.
5. Tlijani K., Guesmi T., Hadj A. H., Ouali A., Optimal location and parameter setting of TCSC based on Sensitivity analysis, First International Conference on Renewable Energies and Vehicular Technology, 2012.
6. Flexible AC transmission system [online], Available at: https://en.wikipedia.org/wiki/Flexible_AC_transmission_system (accessed 07/11/2015).
7. Vinod Kumar G., Srinivasa Rao J., Amarnath J., Transmission congestion management by using series facts devices and changing participation factors of generators, International Journal of Modern Engineering Research (IJMER), 2013, 3(4), p. 2111-2118.
8. Samimi A., Naderi P., A new method for optimal placement of TCSC based on sensitivity analysis for congestion management , Smart Grid and Renewable Energy, 2012, 3(1), p.10-16.
9. Rajalakshmi L., Suganyadevi M.V., Parameswari S., Congestion management in deregulated power system by locating series FACTS devices, International Journal of Computer Applications, 2011, 13(8), p.19-22.
10. Vaidya P. S., Rajderkar V. P, Enhancing power system security by proper placement of thyristor controlled series compensator (TCSC) , International Journal of Engineering and Technology, 2012, 4(5), p. 622-625.
11. Venkatra Y., Srinivasarao J., Contingency analysis in 14-bus power system with TCSC, International Journal of Advanced Research in Electrical, Electronics and Instrumentation Engineering, 2015, 4(11), p. 9330-9348.