Hydro-chemical studies for pollution assessment: A case study
Adebola ADEKUNLE1*, Olufiropo AWOKOLA2, Grace OLUWASANYA3, Abiodun LANIYAN4
1Department of Civil Engineering, Federal University of Agriculture, Abeokuta, Nigeria
2Department of Civil Engineering, Federal University of Agriculture, Abeokuta, Nigeria
3Department of Water Resources Management and Agricultural Meteorology, Federal University of Agriculture, Abeokuta, Nigeria
4Department of Civil Engineering, Federal University of Agriculture, Abeokuta, Nigeria
E-mail(*): maykunle@yahoo.co.uk
* Corresponding author: + (0)8033010552
Abstract
Water is the most abundant liquid on earth which runs steadily to the ocean along vast network of rivers. Rivers are natural courses of water flowing along a bed on the earth towards the ocean and as rivers flow into the ocean, it drains about 60% of the earth’s land surface, and transports concentrated minerals and wastes. Water samples taken from ten sites in Oshun River covering the wet and dry seasons were analyzed to understand the seasonal variability of the physico-chemical and heavy metal contents of the river water. Collected water samples were analyzed using Atomic Absorption Spectro-photometer (AAS), Digital Meters and Titration methods. Results of the analyses indicated that all the physico-chemical variables in the River are within the maximum permissible limit set by World Health Organization (WHO) and Nigerian Standard for Drinking Water (NSDW) except turbidity which recorded high values. Oshun river basin exhibited an overall ionic dominance pattern of Na>K>Ca>Mg and HCO3>Cl>S04, a pattern which is an intermediate between fresh and sea water systems. Mean concentrations of analyzed ions (Ca2+, Mg2+, Na+,K+, Cl-, PO42-, SO42- and HCO3-) were 14.32, 7.97, 41.73, 14.44, 22.53, 4.31, 10.45 and 57.80 mg/l, respectively. Characterization of Oshun River water followed the trend: Na+>K+>Ca2+>Mg2+ and HCO3->Cl-> SO42-. The Pollution Index (PI) value of the River was 0.76.
Keywords
Seasonal variability; Ionic dominance pattern; Pollution Index
Introduction
Rivers are the most important freshwater resource available for man but unfortunately, river waters are being polluted by indiscriminate disposal of sewage, industrial waste and plethora of human activities, which affects their physico-chemical characteristics and microbiological quality [1]. The usual source of drinking water is the streams, rivers, wells and boreholes which are mostly untreated and associated with various health risks [2]. Presently, the menace of water-borne diseases and epidemics still looms large on the horizon of developing countries as a result of lack of accessibility to good quality water. Polluted water has been the cause of all such cases, in which the major sources of pollution are domestic and municipal wastes from urban and industrial activities, runoff from farmland, etc. [3]. Thus, this study deals with the assessment and characterisation of Oshun River Basin water in the south-western part of Nigeria. Student T-test between hydro-chemical parameters has been done with the objective of indicating the nature and the sources of the polluting substances of the River.
Urban runoff worsens the water quality in rivers and lakes by increasing the concentrations of nutrients (phosphorus and nitrogen), sediments, animal wastes (fecal coliform and pathogens), petroleum products, and road salts. Industrial, farming, mining, and forestry activities also significantly affect the quality of rivers as farming can increase the concentration of nutrients, pesticides, and suspended sediments while industrial activities can increase concentrations of metals and toxic chemicals, add suspended sediment, increase temperature, and lower dissolved oxygen in the water [4]. Each of these effects can have a negative impact on the river and make water unsuitable for established or potential uses.
A better representation of the potential problems arising from pollution sources is given by the degree of environmental damage revealed from water quality studies, and it has been remarked that unplanned development has resulted in severe environmental damage and declining quality of life for many people [5]. Therefore, constant groundwater monitoring of a river system is required to evaluate the effects of environmental factors on water quality for proper utilization and sustainable development of the resource.
Several studies in Nigeria had identified anthropogenic activities as easy source of water pollution [6-8], this implies that though water is important to life, it is one of the most poorly managed resources in the world. It has also been observed that scarcity of supply of clean water and heavy pollution of fresh water led to a situation in which one- fifth of the developing countries urban dwellers and three quarters of their rural dwelling population do not have access to reasonably safe water supplies [9], while 75% of the population in developing countries lack adequate sanitary facilities thereby dumping most of their waste in the flowing river which resulted to the pollution of the river. Consequently, water related diseases such as cholera, typhoid fever, hepatitis and dysentery are rampant. Therefore, assessment of water is very crucial to safeguard public health and the environment. The main purpose of assessment is to be able to determine the levels of pollutants present in the water.
Material and method
The Oshun River Basin covers an area in Osun, Ogun and Lagos state of Nigeria, it is located between latitudes 6º30'N and 8º20'N and longitudes 3º23'E and 5ºl0'E. The major drainage system is Oshun River, which rises in the Oke-Mesi ridge about 5 km north of Effon Alaiye on the border between Oyo and Ondo States and flows through the Itawure gap to latitude 7º53'30"N before winding its way first westward through Oshogbo and Ede and then southward to enter the Lagos Lagoon about 8 km east of Epe in Lagos state. The Oshun River is of strategic importance because it is abstracted for water supplies in Ogun, Oshun, and Oyo State. The main tributaries of the river are the Oba, which rises about 15 km north of Ogbomosho in Oyo State, and the Erinle, which rises just south of Offa in Kwara state. The Ona system is located west of the Oshun and comprises the Owa, the Ona, the Ibu and the Omi River systems [10].
The geology of the basin (Figure 1) in the southern part is underlain by sedimentary rocks of cretaceous and later deposits whist the remainder of the Basin composed of crystalline rocks of the basement Complex that form part of the African Crystalline shield. The areal distribution of outcrops of the Crystalline Basement varies considerably, as influenced by differential resistance to weathering of the various rock types, presence of laterite or drift from the sedimentary rocks and presence or absence of erosion by streams. Outcrops are variously identified as isolated boulders, large exfoliated domes and inselbergs, and low smooth areas,Fig. 1shows the geology of the project area.
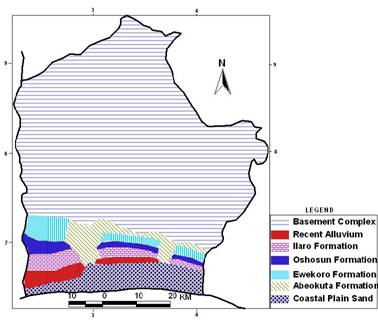
Figure 1. Geological map of Ogun-Oshun river basin
The topography of the Oshun River Basin reflects the contrast between the hummocky terrain underlain by the crystalline rocks to the north with its compact drainage pattern, and the thickly forested undulating hills and swampy lowlands of the sediments to the south. The topography of the Basin overlying the crystalline basement is characterized by a gradually rising elevation from about 30m in the south to about 600m in the north. The relief is moderate with low, forested hills and occasional hog's back quartzite ridges which can be traced for several kilometres.
The larger, older granite masses, and in some places the gneisses and migmatites, create a rugged topography with inselbergs rising abruptly above the surrounding country. The lower basin topography is characterized by two main features, the Ewekoro Depression and the alluvial flood plains. The Ewekoro depression may be described as a low-lying marshy belt, which runs east-southeast across the lower basin about 30m above sea level. The alluvial plain is flanked by the northern and southern uplands lying north and south of the Ewekoro depression, respectively.
The northern uplands consist of plateaux whose surfaces are shaped by the underlying cretaceous sandstones, sloping gently to the south. The southern uplands are characterized by rounded hills separated by deeply incised gullies. In general the wet season occurs from April through October, while a dry season with little or no rainfall occurred between November and March. Seasonal changes in the rainfall of the drainage basin results in alternation of the hydrological regimes of the river. The high water level of the river that arose as a result of the rains made the water flowed unidirectional from July through December.
Sample collection and analysis
Plastic bottles with hard plastic screw caps were used for sample collection. The sampling containers were properly cleaned before use and rinsed with the water to be sampled before sampling. The actual samplings were done in midstream by projecting the mouth of the containers upstream against the flow direction. Three (3) water samples were taken from each selected ten (10) locations repeated five (5) times during the dry and wet season, sample location is on Figure 2.
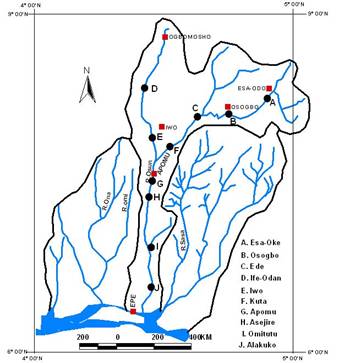
Figure 2. Oshun river basin showing the sampling locations
A thermometer was used for monitoring temperature, while Hatch Camlab pH was used to measure pH, Hanna H198703 Turbidimeter was used to determine turbidity on-site. Other physico-chemical parameters were analyzed in the laboratory using methods prescribed by APHA. Heavy metals in the water samples were analysed using Atomic Absorption Spectrophotometer (AAS) after pre- concentration [11]. Data generated from the monitoring programme were statistically tested for seasonal variation using the student’s t-test.
Determination of the pollution indices of the river
Mean concentrations of pH, Total Dissolved Solids (TDS), Total Hardness, Magnesium, Sulphate and Chloride in milligram/litre were used to determine the Mean Pollution Index (PI) of the river. This was done using the method developed by [12].
PI = √ (MAXIMUM C/L)2 + (MEAN C/L)2 / 2
where: C = Mean Concentration of the Constituents listed above and L = WHO (2008) permissible levels.
Results and discussion
The results of the physicochemical characteristics of water from the river for dry and wet seasons and statistical analysis of the River water parameters compared with standard recommended water quality criteria are shown in Table 1 while the hevy metal concentrations are presented in Table 2 and their significance in Table 3.
Table 2. Heavy metals concentrations (mg/l) in Oshun River water
|
Sample |
Season |
Pb |
Cd |
Cu |
Fe |
Mn |
Zn |
|
Esa- Oke |
Wet |
0.003 |
0.003 |
0.064 |
2.1 |
0.076 |
0.040 |
|
Dry |
0.015 |
0.010 |
0.075 |
2.3 |
1.088 |
0.094 |
|
|
Osogbo |
Wet |
0.009 |
0.003 |
0.101 |
2.6 |
0.200 |
0.030 |
|
Dry |
0.045 |
0.012 |
0.342 |
0.9 |
0.445 |
0.020 |
|
|
Ede |
Wet |
0.035 |
0.032 |
0.056 |
2.4 |
0.062 |
0.010 |
|
Dry |
0.084 |
0.018 |
0.045 |
1.2 |
0.210 |
1.062 |
|
|
Ife Odan |
Wet |
0.005 |
0.010 |
0.027 |
2.8 |
0.120 |
0.025 |
|
Dry |
0.026 |
0.002 |
0.060 |
1.3 |
0.195 |
0.135 |
|
|
Iwo |
Wet |
0.025 |
0.006 |
0.034 |
3.2 |
0.240 |
0.069 |
|
Dry |
0.005 |
0.014 |
0.017 |
2.1 |
0.165 |
0.102 |
|
|
Kuta |
Wet |
0.010 |
0.003 |
0.040 |
2.4 |
0.076 |
0.145 |
|
Dry |
0.050 |
0.010 |
0.066 |
2.9 |
1.602 |
0.015 |
|
|
Apomu |
Wet |
0.018 |
0.009 |
0.040 |
2.2 |
0.043 |
0.018 |
|
Dry |
0.134 |
0.003 |
0.073 |
2.2 |
0.127 |
0.074 |
|
|
Asejire |
Wet |
0.009 |
0.020 |
0.012 |
2.9 |
0.102 |
0.020 |
|
Dry |
0.012 |
0.001 |
0.045 |
1.3 |
0.080 |
0.074 |
|
|
Omitutu |
Wet |
0.010 |
0.010 |
0.010 |
2.2 |
0.060 |
0.021 |
|
Dry |
0.016 |
0.003 |
0.062 |
1.1 |
0.123 |
0.287 |
|
|
Alakuko |
Wet |
0.003 |
0.007 |
0.026 |
2.1 |
0.082 |
0.020 |
|
Dry |
0.042 |
0.010 |
0.083 |
1.7 |
0.106 |
0.072 |
Table 1. Statistical analysis of Oshun River water parameters compared with standard recommended water quality criteria
|
Parameters |
Range |
G.Mean |
Std Dev. |
CV |
T cal |
Desirable Limit |
Permissible Limit |
Organization |
|
Temp°C |
27.0-31.50 |
28.92 |
1.55 |
5.37 |
5.762 |
30 |
34 |
NSDW |
|
Colour (H.U) |
1.45-5.68 |
3.99 |
1.52 |
38.14 |
7.446 |
|
|
|
|
Turbidity (NTU) |
6.30-13.90 |
10.70 |
2.28 |
21.33 |
-2.626 |
<1 |
5 |
WHO, NSDW |
|
Ph |
6.10-6.92 |
6.52 |
0.29 |
4.43 |
9.631 |
7 – 8.5 |
6.5 – 9.2 |
WHO, NSDW |
|
TH (mg/dm3) |
8.67-20.00 |
13.22 |
2.66 |
20.29 |
-0.646* |
100 |
500 |
FEPA, ICMR |
|
DO (mg/dm3) |
6.50-12.30 |
10.02 |
1.62 |
16.19 |
0.025* |
|
|
|
|
TDS (mg/dm3) |
76.00-123.00 |
98.83 |
15.07 |
15.25 |
5.024* |
500 |
1500 |
ICMR |
|
Cl- (mg/dm3) |
13.00-37.00 |
22.53 |
8.36 |
37.11 |
3.343* |
250 |
600 |
WHO, NSDW |
|
Po42- (mg/dm3) |
1.30-6.60 |
4.31 |
1.17 |
27.06 |
0.880* |
3.5 |
6.1 |
EC |
|
Ca2+ (mg/dm3) |
10.08-21.40 |
14.32 |
3.65 |
25.48 |
2.470* |
75 |
200 |
ICMR NSDW |
|
K+ (mg/dm3) |
11.46-18.34 |
14.44 |
9.53 |
15.68 |
0.724 |
|
|
|
|
Mg2+ (mg/dm3) |
3.47-14.78 |
7.97 |
3.05 |
38.29 |
-0.529* |
30 |
150 |
WHO, NSDW |
|
So42- (mg/dm3) |
4.00-18.02 |
10.45 |
4.48 |
42.89 |
4.818* |
- |
500 |
FEPA |
|
Na+ (mg/dm3) |
6.76-65.90 |
41.73 |
17.53 |
42.01 |
-3.958 |
50 |
175 |
WHO |
|
HCO3- |
20.00-100.0 |
57.80 |
22.40 |
38.40 |
0.666* |
|
|
|
|
Pb |
0.00-0.13 |
0.028 |
0.032 |
|
-0.380* |
|
0.01 |
NSDW |
|
Cd |
0.00-0.03 |
0.009 |
0.008 |
|
1.516* |
|
0.05 |
WHO |
|
Fe |
0.90-3.20 |
2.095 |
0.069 |
|
1.304 |
|
0.3 |
NSDW |
|
Mn |
0.04-1.60 |
0.269 |
0.656 |
|
-0.046 |
|
0.05 |
WHO |
|
Zn |
0.01-1.06 |
0.116 |
0.391 |
|
0.579 |
|
3.0 |
NSDW |
|
Cu |
0.01-0.34 |
0.063 |
0.232 |
|
0.818 |
|
0.05 |
WHO |
|
G. Mean = Grand mean; SD = Standard Deviation; CV = Coefficient of Variation;t cal = t values calculated for test of significant difference between dry and wet season; *Significant p < 0.05. WHO: World Health Organization; ISI: Indian Standard Institution; ICMR: Indian council of Medical Research; EC: European Community; EPA: Environmental Protection Agency; FEPA: Federal Environmental Protection Agency; NSDW: Nigerian Standard for Drinking Water |
||||||||
The mean concentrations of pH, Total Dissolved Solids (TDS), Turbidty and Dissolved Solid (DO) of the Oshun River water were 6.52, 98.83, 10.70 and 10.02 mg/l, respectively. All the physico-chemical variables of the River are within the maximum permissible limit set by World Health Organization (WHO) and Nigerian Standard for Drinking Water (NSDW) except turbidity which recorded high values. It is however, noted that the reduced rate of increase in the mean concentrations of all the parameters and a lowering of the pH of the Oshun River Water is a potential hazard if the trend is not checked.
Table 3. Statistical analysis of Oshun River water heavy metal parameters
|
Parameters |
Range |
Mean |
Std Dev. |
T cal |
NSDW/ WHO |
|
Pb |
0.00 - 0.13 |
0.028 |
0.032 |
-0.380* |
0.01/NSDW |
|
Cd |
0.00 - 0.03 |
0.009 |
0.008 |
1.516* |
0.05/WHO |
|
Cu |
0.01 - 0.34 |
0.063 |
0.069 |
1.304 |
0.05/WHO |
|
Fe |
0.90 - 3.20 |
2.095 |
0.656 |
-0.046 |
0.3/NSDW |
|
Mn |
0.04 - 1.60 |
0.269 |
0.391 |
0.579 |
0.05/WHO |
|
Zn |
0.01 - 1.06 |
0.116 |
0.232 |
0.818 |
3.0/NSDW |
|
G. Mean = Grand mean; CV = Coefficient of variation; SD = Standard Deviation; T cal = t values calculated for test of significant difference between dry and wet season; *Significant p < 0.05, NSDW = Nigerian Standard for Drinking Water, WHO = World Health Organization |
|||||
Ionic dominance pattern
The estimated means and standard deviations of major elements (both cations and anions) for the river basins were calculated to examine the overall ionic dominance pattern of the rivers in order to predict the nature and the sources of polluting substances. The Oshun river basin exhibited an overall ionic dominance pattern of Na>K>Ca>Mg and HCO3>Cl> SO4, the ionic dominance of this river basin was in contrast with the ionic dominance pattern of Ca>Mg>Na>K and HCO3>SO4>Cl for fresh water and Na>Mg>Ca>K and Cl>SO4>HCO3 for sea water. Thus, like most tropical fresh waters there is a dominance of Na and HCO3 in the cationic and anionic components, respectively [13].
Major cations and anions
The mean concentrations of the major cations and anions of the river conform to World Health Organizations standard for safe drinking water. The overall mean values of Ca2+, Mg2+, K+, and Na+ the River were 14.32, 7.97, 14.44 and 41.73 mg/l, respectively while the mean values of HCO3-, Cl−, and SO42- were 57.70, 22.53, and 10.45 mg/l respectively. Characterization of Oshun river water followed the trend: Na+>K+>Ca2+>Mg2+ (for the cations) and HCO3>Cl>SO4 (for anions), also showing that the Oshun River water is NaHCO3 water. The results indicate that the concentrations of the constituent major cations and anions o the river water is generally moderate; this is typical of most tropical African lakes [13]. The nutrient level of the river indicated by the concentrations of phosphates is very low in some of the observed sites; which shows that the river has moderately low eutrophication level.
Pollution index
The mean Pollution Indices (PI) of Oshun River is 0.76 ( Tables 4 and 5). It has been noted that the critical value of Pollution Index is 1; hence, pollution index of more than 1 indicates very high degree of pollution [12]. However, there is need to monitor the PI value since it is already tending to the critical value of 1. The observed pollution trends in the Oshun River necessitates appropriate monitoring procedures for pollution control and mitigation for a sustainable development of the resource.
Water uses of the rivers
There are both consumptive and non-consumptive water uses within the study area. Consumptive water uses include withdrawals of raw water for domestic water supplies, irrigation, and livestock watering. Non consumptive water uses include in stream uses by fish and aquatic life, and recreation and aesthetics.
Table 4. Parameters used in calculating Pollution Index
|
S/No |
Parameters Considered |
WHO Lower Limit (L) |
OShun mean constituent (C2) |
OShun (C2/L) |
|
1 |
pH |
6.50 |
6.52 |
1.003 |
|
2 |
TDS (mg/l) |
500 |
98.83 |
0.198 |
|
3 |
Total Hardness(mg/l) |
50 |
13.22 |
0.264 |
|
4 |
SO42- (mg/l) |
400 |
10.45 |
0.026 |
|
5 |
Cl- |
250 |
22.53 |
0.090 |
|
6 |
Na+ (mg/l) |
50 |
41.73 |
0.835 |
|
7 |
Mg 2+(mg/l) |
30 |
7.97 |
0.266 |
Table 5. Pollution Index of Oshun River
|
S/No |
Parameter |
Value |
|
1 |
Maximum (C/L) |
1.003 |
|
2 |
Mean (C/L) |
0.383 |
|
3 |
PI Value |
0.76 |
The Rivers and their tributaries provide habitats for a number of important fish species. Aquatic habitats within the watershed also support a variety of resident fish species, aquatic invertebrates, amphibians, reptiles, birds, and mammals. The rivers are also becoming increasingly important for recreational water uses, including swimming, canoeing and bird watching.
Ionic dominance pattern within two basins (Oshun and Ogun river basin)
The estimated means and standard deviations (Figure 3) of major elements (both cations and anions) for Oshun river basins were calculated to examine the overall ionic dominance pattern of the rivers in order to predict the nature and the sources of polluting substances. The Oshun river basin exhibited an overall ionic dominance pattern of Na>K>Ca>Mg and HCO3>Cl>SO4 while Ogun river basin exhibited an overall ionic dominance pattern of Na>Ca>K> Mg and HCO3>SO4>Cl, the ionic dominance of these river basins were in contrast with the ionic dominance pattern of Ca>Mg>Na>K and HCO3>SO4>Cl for fresh water and Na>Mg>Ca>K and Cl>SO4>HCO3 for sea water [13]. Thus, like most tropical fresh waters there is a dominance of Ca and HCO3 in the cationic and anionic components, respectively [14]. It is apparent that the dominance of chloride over sulphate in Oshun basin could be due to the large amount of domestic wastes being discharged into the river waters. Sodium showed the highest variation within the sampling period. The high threshold value was due to the high level of domestic activities in the catchment.
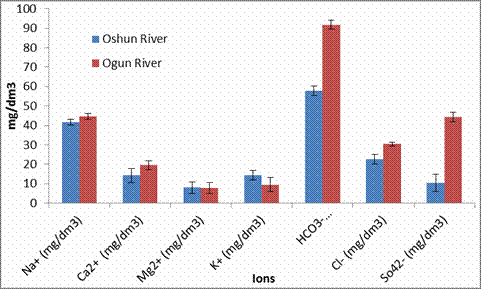
Figure 3. Mean ± standard deviation of ion (mg/dm3) in Ogun and Oshun river basin
Conclusion
Our results indicated that most of the physico-chemical variables of the River are within the maximum permissible limit set by World Health Organization (WHO) and Nigerian Standard for Drinking Water (NSDW). The high turbidity observed in the basin is attributable to poor farming practices which result to large quantities of top soil ending up in the river after heavy rains. Turbidity indicates the presence of organic suspended material which promotes the growth of microorganisms. Nutrient loads in the OshunRiver were mainly from domestic, agricultural and commercial activities. The Oshun basin exhibited a general ionic dominance pattern of Na>Ca>Mg>K and HCO3>Cl>SO4. Both cationic and anionic patterns were intermediate between those of fresh and sea water but the dominance of chloride over sulphate could probably be due to domestic activities resulting from household effluents, fertilizer use and anthropogenic point sources.The observed pollution trends in the Oshun River necessitates appropriate monitoring procedures for pollution control and mitigation for a sustainable development of the resource.
References
1. Fresenius W., Quentin K. E., Scheider W., Water Analysis - A practical guide to physico- chemical, chemical and microbiological water examination and quality assurance, 2006, 804, Springer Verlag.
2. Agbaire P. O., Obi C.G., Seasonal Variations of Some Physico-Chemical Properties of River Ethiope Water in Abraka, 2009, Nigeria J. Appl. Sci. Environ. Manage., 2009, 13(1), p. 55-57.
3. Baig S., Mahmood Q., Nawab B., Hussain A., Nafees M., Assessment of Seasonal Variation in Surface Water Quality of Chitral River, North West Frontier Province, (NWFP), World Applied. Science Journal, 2010, 9(6), p. 674-680.
4. Ololade I. A., Oginni O., Toxic stress and haematological effects of nickel on African catfish, Sci. Eng., 2010, 8, p. 58-63.
5. Ogubanjo M. I., Rolajo O. A., The Impact of Solid Waste Disposal on the Chemical Quality of Surface and Subsurface Water Resources in parts of IBADAN Metropolis, South-western Nigeria, Water Resources, 2004, 15, p. 26-32.
6. Ayoade J. O. Human Impact on the Environment in Filani et al (Eds), 1994, Ibadan Region, Ibadan. Rex Charles Pub.
7. Obasi R. A., Balogun O., Water Quality and Environmental Impact Assessment of Water Resources in Nigeria, African Journal of Environment Studies, 2012, 2, p. 228-231.
8. Ovrawah L., Hymore F. K., Quality of Water from Hand-Dug Wells in Warri Environs of Niger Delta Region, African Journal of Environmental Studies, 2012, 2, p. 169-173.
9. World Health Organisation, “Guidelines for Drinking-Water Quality,” 3rd Edition, World Health Organisation, Geneva, 2008.
10. Oshun River Basin Feasibility Study Report 1982: Tahal Consultants (Nig.) Ltd in Association with Associated Engineers and Consultants (Nig.) Ltd.
11. Aiyesanmi A. F., Baseline Concentration of Heavy Metals in Water Samples from Rivers within Okitipupa South- east Belt of the Nigerian Bitumen Field, Journal of Chemical Society of Nigeria, 2006, 31(1-2), p. 30-37.
12. Horton R. K., An Index Number System for Rating Water Quality, Journal of the Water Pollution Control Federation, 1965, 37(3), 12 pp.
13. Burton J. D., Liss P. S., Estuarine Chemistry. Academic Press, 1976, London. 229 pp.
14. Oliver R. N., Lakes of Nigeria, Nigeria Geography Stubs, Mining and Geology, 2005, 25(5), 9 pp.