Tensile and hydrophilic properties of low-density polyethylene/titania composites
Oluyemi Ojo DARAMOLA1*, Isiaka Oluwole OLADELE2, Benjamin Omotayo ADEWUYI3 Jimmy Lolu OLAJIDE4, Adekunle Sulaimon OGUNBADEJO5 and Paul ADEYEMI6
1-6 Department of Metallurgical and Materials Engineering, Federal University of Technology, P.M.B. 704, Akure, Nigeria
E-mail(s): 1ojaythompsoms@yahoo.com; 2wolesuccess2000@yahoo.com; 3tayo_adewuyi@yahoo.com; 4jimmylolu@gmail.com; 5adekunleogunbadejo@gmail.com and 6mosbayo@gmail.com
* Corresponding author, phone: +2348166814002
Abstract
Low-density polyethylene is a vastly used engineering material owing to its low cost, high formability, recyclability, relative availability and the possibility of improving its properties when reinforced/filled with other materials. However, when filled with some inorganic particulates, increase in the population of the particulates leads to increased hydrophilicity in the material and a weakened mechanical bonding energy between the fillers and the matrix material overtime. This study has demonstrated that optimum combination of mechanical and hydrophilic properties of low-density polyethylene for water-based applications can be achieved by filling its matrix with 1 – 3 volume % of 0.5 µm particulates of TiO2. The composites used in this study were developed by compression moulding technique and studied via scanning electron microscopy, tensile, flexural and water absorption tests.
Keywords
Tensile; Flexural; Hydrophilic; Low Density Polyethylene; Inorganic Particulates; Compression Moulding Technique; Scanning Electron Microscopy
Introduction
The past few decades have witnessed an enormous corpus of investigations on the effect of Moisture Uptake Potential (MUP) on the mechanical properties of polymers composites [1-3]. Many results of these investigations have been able to clearly establish that increasing MUP in these materials most often than not, precipitates the degradation of their mechanical properties and this in turn has greatly roused the interests of researchers working on polymeric composites used for water-based applications. Typical applications in this regard include: marine outfalls, sewage pipes, hydroelectric pipes, minerals-conveying pipes and agricultural irrigation pipes [4-6]. A recognized example of polymeric material that has been extensively used for these applications is polyethylene due to its low MUP, excellent corrosion resistance and appreciable mechanical properties [7].
However, polyethylene and their composites still suffer from the foregoing problem. In an attempt to considerably abate these shortcomings, Yuan et al were able to develop a super-hydrophobic High Density Polyethylene (HDPE) surface prepared by adding ethanol to the resin in humid atmosphere [8]. A new approach of developing multifunctional titanium dioxide (TiO2)/HDPE nanocomposite surfaces exhibiting super-hydrophobicity, ultraviolet-induced reversible wettability and self-cleaning properties has been investigataed [9]. A review on the chemical treatments of natural fibres for use in natural fibre-reinforced composites made it clear that appropriate chemical treatments of natural fibres prior to their introduction in the matrices of polymers can significantly reduce their MUP and simultaneously improve their mechanical properties for long-term water-based applications [10]. Despite these remarkable achievements, the financial resources and the technology adopted for these approaches are not equally accessible to researchers globally, especially those in the developing countries [11].
Presently, researchers from Nigeria and other African countries are relentlessly seeking cost-effective approaches in developing effective and functional polymer composites for water-based applications by fully exploiting the potential use of natural fibres, agro-ashes and mineral fillers as reinforcements/fillers in their matrices [12-15]. However, the major challenge associated with most of these fibres and fillers is their hydrophilic nature which they seem transfer to the polymer composites as their population increases in the matrix [16-17]. Although, chemical modification of the fibres and fillers have been documented to be somewhat effective, their reliability overtime for water-based applications is not guaranteed due to the weakening of the mechanical bonding energy between the fibre/filler-matrix interface, once the effect of the chemical treatments on such fibres/fillers begins to wane [10,17-21]. Therefore, it becomes imperative to seek the optimum population of natural fibres/mineral fillers that will simultaneously reduce the MUP and improve the mechanical properties of the resultant composites in the absence of chemical modification.
Hitherto, to our knowledge, most researchers have extensively focused on improving the hydrophobicity and mechanical properties of HDPE for water-based applications with modest effort on that of the other types of polyethylene [22-24]. In the present study, untreated TiO2 particulate was selected as the filler to develop Low Density Polyethylene (LDPE) composites for water-based applications. TiO2 is a white solid inorganic substance that is highly rigid, thermally stable, non-flammable, poorly soluble in many solvents, biocompatible and not classified as hazardous. Its major applications can be seen in a variety of products which include paints, coatings, plastics, paper, inks, fibres, food, medicine and cosmetics [25-26]. Furthermore, it has been successfully used to fill many polymers [27-29]. It was particularly selected in this study due to its poor solubility in water, ability to bond with many substrates and apparent chemical inertness [30].
The main objective of this study was to establish the volume % of untreated submicron TiO2 particulates required for optimizing the MUP and mechanical properties of the LDPE/TiO2 composites for water-based applications.
Material and method
Commercial grade rutile TiO2 powder of 0.5 µm particle size and density of 4.23 g/cm3 was used in this research as the reinforcing material. The TiO2 powder was sourced and procured from Alfa Aesar High Purity Research Chemicals, Vorna Valley, Republic of South Africa and the for the matrix phase, LDPE powder with melt flow index of 2.25 g/min and density of 0.923 g/cm3 was supplied by DOW Chemicals, Republic of South Africa.
Compounding of the composite materials
Predetermined proportion of LDPE and Titania powder were mixed together in a tumbler mixer for 20 minutes in other to obtain homogeneous mixture. Each mixed samples was melt-blended together using a Rapra Single-Screw Extruder at a temperature of 90oC-120oC and rotor speed of 40 rpm. The extudates were ground with a grinding machine. Tables 1 and 2 show the proportion of the constituents added in grams and weight percent for Flexural and Water absorption tests and Tensile test respectively.
For accurate extrapolation and prediction of properties from the obtained results, the plot of tensile and flexural properties versus volume percent of filler (VPF) was used in this study. The VPF was calculated as presented in Equation 1.
|
|
(1) |
where vf and vc are the volume of filler and volume of composite respectively.
Table 1. Proportion of constituents added in wt. %, vol. % and grams for the flexural and water absorption tests
|
Sample designation (VPF) |
Wt. % of TiO2 particulate |
Wt. % of LDPE |
Weight of TiO2 particulate (g) |
Weight of LDPE (g) |
Vol. % of TiO2 particulate |
|
0 |
0 |
100 |
0 |
60 |
0 |
|
1.261 |
2 |
98 |
1.2 |
58.8 |
1.261 |
|
2.522 |
4 |
96 |
2.4 |
57.6 |
2.522 |
|
3.783 |
6 |
94 |
3.6 |
56.4 |
3.783 |
|
5.043 |
8 |
92 |
4.8 |
55.2 |
5.043 |
|
6.304 |
10 |
90 |
6.0 |
54 |
6.304 |
Table 2. Proportion of constituents added in wt. % and grams for the tensile test samples
|
Sample designation (VPF) |
Wt. % of TiO2 particulate |
Wt. % of LDPE |
Weight of TiO2 particulate (g) |
Weight of LDPE (g) |
|
0 |
0 |
100 |
0 |
0 |
|
1.261 |
2 |
98 |
0.6 |
29.4 |
|
2.522 |
4 |
96 |
1.2 |
28.8 |
|
3.783 |
6 |
94 |
1.8 |
28.2 |
|
5.043 |
8 |
92 |
2.4 |
27.6 |
|
6.304 |
10 |
90 |
3.0 |
27 |
Development of neat LDPE and LDPE/TiO2 composites by compression moulding technique
Prior to the introduction of the moulds into the compression moulding machine, the exrudates were poured into different metallic moulds designed for tensile and flexural tests. Facilitation of the ease of removal of test samples from the moulds was achieved by using Teflon sheet to cover the upper and lower surfaces of the samples and silicone sprayed at the inner edges of the moulds. For tensile test samples, a mould that can sufficiently accommodate 14 mm gauge length was used and for flexural test samples a rectangular mould of dimension 150 mm × 100 mm × 4 mm was used. Furthermore, the compression moulding was carried out at 120oC for 8 minutes under applied pressure of 0.2 kPa and this was ensued by air cooling of the developed test samples.
Density computation of LDPE/TiO2 composites
For density comparison between the neat LDPE and the LDPE/TiO2 composites, the densities of composites were calculated by linear rule of mixture as presented in Equation 2.
|
|
(2) |
where mf is the mass fraction of filler in the composite and ρC, ρM and ρf are densities of the composite, matrix and filler respectively [31]. The obtained densities were then used to calculate the volume percent of filler (VPF).
Properties test
The composites cast samples were subjected to tensile test, flexural test and water absorption test. Scanning Electron Microscope was used to investigate the miscibility between the particulate and the matrix interface at the tensile fractured surfaces of the composites
Tensile test
The ultimate tensile strength, tensile strength at yield, tensile modulus and strain to fracture of the neat LDPE and the LDPE/TiO2 composites were determined with the aid of an American brand INSTRON universal 5966 tester, 2010 model, in accordance with ASTM D638-10 standard. The samples were developed with dog-bone geometry with a gauge length of 14 mm. The dog-bone-shaped samples were tested in tension mode at a single strain rate of 5 mm/min approximately 27oC and relative humidity of 40%. The test samples having gauges were fixed at the edge of the upper and lower grips of the machine and the test commenced. As the materials underwent deformation in response to an applied load cell of 10 kN, important tensile properties data were generated and necessary graphs were automatically plotted. Six repeatability tensile tests were done for each determined tensile property of the materials and their mean values were used in this research.
Flexural test
The flexural strength at yield and the flexural modulus of the neat LDPE and LDPE/TiO2 composites were determined with the aid of an American Brand Electromechanical-Computerized Universal Testing Machine, INSTRON series 3369 model, in accordance with ASTM D790 standard. The flexural test samples were developed with a rectangular geometry and a dimension of 150 mm × 50 mm × 4 mm. To determine flexural properties, the test samples were hooked on fixed grips of the machine and the test commenced. As the materials underwent deformation in response to applied load, important flexural properties data were generated and necessary graphs were automatically plotted. Six repeatability flexural tests were done for each determined flexural property of the materials and their mean values were used in this research.
Water absorption test
The water absorption test in this research was conducted in accordance with the ASTM D5229M-12 standard. Prior to the immersion of test samples obtained from the neat LDPE and the LDPE/TiO2 composites in rain water, the initial weight of each sample was taken by a digital weighing scale and recorded. Subsequent weights of the samples were taken at a time interval of 24 hours for a period of 96 hours that was when the materials were observed to have reached their water saturation stages. For appropriate measurements, it was ensured that the materials were invariably dried before subsequent weighing was taken. Experimental temperature for this study ranged between 25oC and 27oC. The criteria used for studying the hydrophilic behaviour of the materials are the water % absorption (WPA), rate of water absorption and mechanism of water diffusion. The amount of water absorbed by the neat LDPE and the LDPE/TiO2 composites in % was calculated using Equation 3.
|
|
(3) |
where W is WPA, wt is weight of dried sample after time, t and wd is initial weight of sample before subsequent immersions in water. Correspondingly, the mechanism of water diffusion in the neat LDPE and the LDPE/TiO2 composites was studied using the Sombastsompop and Chaochanchaikul relation [32] presented in Equations 4 and 5.
|
|
(4) |
|
|
(5) |

where MT is water absorption at time T, M∞ is water absorption at saturation point, K is a constant related to the polymer network structure, and n is the release exponent which determines the type of diffusion.
The hydrophilic behaviour of the neat LDPE and the LDPE/TiO2 composites was studied by the WPA plot, weight gained versus exposure time plot and log MT/M∞ versus log T plot. Three repeatability tests were done for each determined hydrophilic property and their mean values were used in this study.
Scanning electron microscopy (SEM) examination
Microstructural characterization of the neat LDPE and the LPDE/TiO2 composites was achieved by using a German brand AURIGA scanning electron microscopy, Carl Zeiss model, with an accelerating voltage of 15 kV. Fractured surfaces of the neat LDPE and LDPE/TiO2 composites obtained from post-tensile test operations were mounted on aluminium stubs and sputter coated with gold using EMITECH K950X sputter coater before being subjected to SEM examination.
Results and discussion
Tensile and flexural test
The plots of tensile and flexural properties versus VPF for the neat LDPE and the LDPE/TiO2 composites are presented in Figures 1 to 3.
Figure 1. Variations of tensile and flexural moduli with VPF for the neat LDPE and the LDPE/TiO2 composites
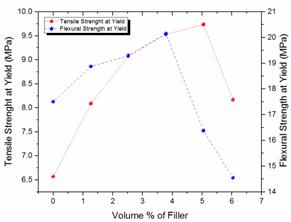
Figure 2. Variations of tensile and flexural yield strengths for neat LDPE and LDPE/TiO2 composites
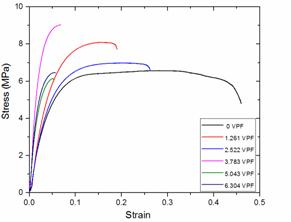
Figure 3. Stress-strain curves for neat LDPE and LDPE/TiO2 composites
Tensile and flexural modulus
Figure 1 shows increase in tensile and flexural modulus of the LDPE/TiO2 composites with increase in VPF and this relationship is linear as shown by linear fittings on the plots. Observations from these results revealed that the tensile and flexural moduli of the LDPE/TiO2 composites at 6.304 VPF have increased by 309.84% and 12.28% respectively, in comparison with the performance of the neat LDPE. The trend of the results revealed an increase in the moduli of the LDPE/TiO2 composites with corresponding increase in VPF.
The underlying strengthening mechanisms in the LDPE/TiO2 composites can be credited to very high modulus of the TiO2 particulate (230 ± 20 GPa) relative to that of the LDPE polymer (0.3 GPa) [34-35]. There was also sufficient time to arrange the molecules in the energetically favourable more densely packed crystal structure. The crystal phase is stiffer than the amorphous regions of composites and the bond strength between the chain molecules is higher in the crystalline regions of a semi-crystalline thermoplastic than in the amorphous regions because the chains are more compacted, hence having less free volume [36-37]. Improved filler orientation within the matrix significantly improves the modulus of thermoplastics composites [38]. Other supporting factors could be orientation of the chain molecules in the load direction, impeded sliding of the chains, and the strength of interaction between the LDPE and the TiO2 particulates (the amount of bonded LDPE) which is principally dependent on the surface area of the TiO2 particulate [39-40]. It can be said that the 0.5 µm particle size used in this study provided a surface area large enough for the fillers to significantly improve the stiffness of the LDPE/TiO2 composites. The low stiffness observed in the neat LDPE is because it consists of only simple and mobile molecules with weak intermolecular bonds [41].
Tensile and flexural yield strengths
Figure 2 presents the tensile and flexural yield strengths of the neat LDPE and the LDPE/TiO2 composites. From the results, it was observed that the tensile and flexural strengths at yield of the neat LDPE/TiO2 composites have increased by 48.10 and 15.12 % respectively, in comparison with the performances of the neat LDPE composites and this was revealed at 5.043 VPF and 3.783 VPF for the tensile and flexural strengths at yield of the LDPE/TiO2 composites, respectively. However, beyond these VPF(s) both yield strengths of the LDPE/TiO2 composites were observed to decrease. Decreasing yield strength of particulate filled thermoplastics at high VPF has been a recurrent problem of thermoplastics filled with spherical particulates except in cases where the surface area of the particulate is very large as in the case of ultrafine powders (about 0.01 µm); however, 0.5 µm was used in this study. Ultrafine powders have large surface areas which allow more matrix materials to be strongly bonded to the particulates (because their greatest surface per particle exert a greater viscous drag on the polymer per unit volume of the polymer to aid in molecular alignment) resulting in a composite with improved modulus and yield strength [42-44]. In addition, the polarities of thermoplastics and fillers have been emphasized to have great influence on the yield strength of the resultant composite. LDPE is a non-polar polymer while TiO2 particulate is a polar mineral filler which requires a surface treatment to make its surface also non-polar prior to the composites development [45]. The surface treatment of TiO2 particulate will improve the adhesive bonding strength between the filler and the matrix material [46]. The untreated TiO2 powder used in this study might have contributed to the observed decrease in yield strengths of the LDPE/TiO2 composites at high VPF as particle-particle interaction becomes predominant, thus lowering effective polymer-filler interaction [47]. Furthermore, the yield strength of particulate filled composites has been reported to be strongly dependent on the thickness and nature of the interphase between the filler and the matrix material [48-49]. It is believed in this study that the thickness and nature of the interphases between the LDPE and the TiO2 particulates within the resultant composites were not favourable enough for improvement of yield strength at high VPF.
Ultimate tensile strength and strain to fracture
The influence of the TiO2 particulates on the ultimate tensile strengths and strains to fracture of the LDPE/TiO2 composites are presented with a stress versus strain curve in Figure 3.
The trend observed in the results of the LDPE/TiO2 composites with respect to ultimate tensile strength showed almost a similar pattern as was observed in Figures 1 and 2. There is a appreciable improvement in ultimate tensile strengths of the LDPE/TiO2 composites in comparison with the neat LDPE. The ultimate tensile strength of the neat LDPE/TiO2 increased by approximately 29 % in comparison with the performance of the neat LDPE and this was revealed at 3.783 VPF. However, beyond this filler loading, the ultimate tensile strengths of the LDPE/TiO2 composites were observed to start decreasing and this can be linked with the aforementioned factors explained under the discussion on yield strength with respect to high VPF. Observations from the results of strains to fracture of the LDPE/TiO2 composites revealed no significant improvement in this property. In fact, the neat LDPE demonstrated the superlative performance and for the LDPE/TiO2 composites the best performance was observed at 2.522 VPF. The superlative performance of the neat LDPE simply implies that it has the highest ductility which can be attributed to its low crystallinity and highly deformable amorphous regions [50]. In addition, it was observed that the strain to fracture varied inversely with increase in VPF. This phenomenon can be as a result of the presence of TiO2 agglomerates within the LDPE matrix shown in Figures 11 and 12. These agglomerates are formed at high filler concentration because at this level. The average interparticle distance is smaller and the London-van der Waal forces of attraction allow particles to have strong affinity for each other than for the matrix material, which in turn favours formation of particle agglomerates and disfavours polymer- filler bonding [51-52]. These agglomerates break easily in response to applied stress and broken agglomerates are strong stress concentrators which are weak points where crack initiation and particle debonding starts in the composite [53]. Particle debonding has been reported to be the predominant deformation mode in particulate filled composites. As the particles debond they create voids within the composite, thereby facilitating crack propagation and reducing the resistance of the material to failure. Large agglomerates leave large voids in the material resulting in a material with very low strain to fracture [54].
Hydrophilic properties
The plots of WPF versus VPF, weight gained versus the exposure time; and the diffusion fitting curves for the neat LDPE and the LDPE/TiO2 composites at different VPFs are presented in Figures 4 to 6.
Figure 3. Variation of % water absorption with VPF for neat LDPE and LDPE/TiO2 composites
Figure 4. Variation of weight gained due to water absorption by Neat LDPE and LDPE/TiO2 composites with exposure time
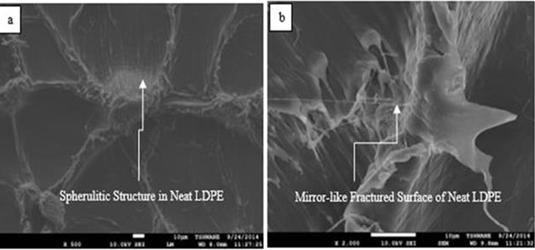
Figure 6. SEM images of post-tensile test fractured surfaces of neat LDPE at different magnifications (a: ×500; b: ×2000)
Percentage water absorption and rate of water absorption
The presence of hydrophilic fillers and filler agglomerates in the structure of LDPE composites has been reported to either increase or decrease the MUP of filled- LDPE composites [55-56]. From Figures 4 and 5, it was observed that water absorption increased with filler loading from 1.261-6.304 VPF, although at low VPF (below 3 VPF) MUP of the LDPE/TiO2 composite is lower than that of the neat LDPE. For the 1.261 and 2.522 VPF, 72.53 and 17.90 % reductions in MUP were observed respectively in comparison with that of the neat LDPE. At high VPF, above 3 VPF, an increase in this potential was observed. The maximum weight gain was at 6.304 VPF. In essence, the physical and chemical properties of TiO2 are dominantly determined by its surface condition [57], hence, the dependence of its hydrophilicity on the condition of its surface area. Therefore, the lower weight gain, relative to the neat LDPE, observed at 1.261 and 2.552 VPF is probably due to the effective surface area of the TiO2 particulates required for water absorption being used up in bonding with the matrix phase.
This also affected the water absorption rate in about the same manner as evident in the steepness of the linear parts of the slopes in Figure 5. This was corroborated by the SEM images in Figures 6 and 7 which revealed well-dispersed particulates in the polymer matrix. However, as the volume of the filler increases, more agglomerates as shown in SEM images in Figures 8, 9 and 10 are available to increase both the water % absorption and water absorption rates of the composites [58].
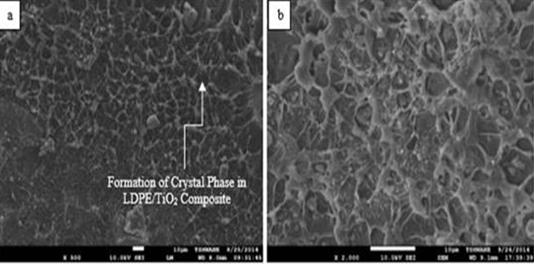
Figure 7. SEM images of post-tensile test fractured surfaces of 1.261 VPF LDPE/TiO2 composites at different magnifications (a: ×500; b: ×2000)
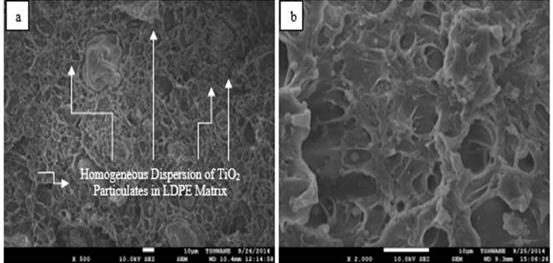
Figure 8. SEM images of post-tensile test fractured surfaces of 2.522 VPF LDPE/TiO2 composites at different magnifications (a: ×500; b: ×2000)
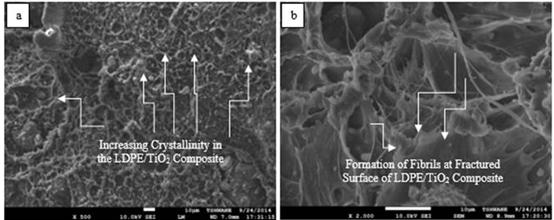
Figure 9. SEM images of post-tensile test fractured surfaces of 3.783 VPF LDPE/TiO2 composites at different magnifications (a: ×500; b: ×2000)
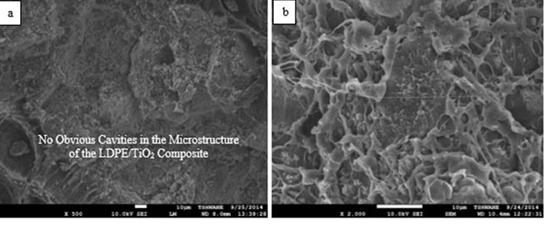
Figure 10. SEM images of post-tensile test fractured surfaces of 5.043 VPF LDPE/TiO2 composites at different magnifications (a: ×500; b: ×2000)
This made the water absorption to climb steadily for all the samples and they all equilibrated after 50 hours of exposure time. This general increase in water absorption is because untreated TiO2 particulates used in this study have hydroscopic surfaces. Increase in particle-particle interactions will favour the diffusion of water molecules into the composites as the hydrophobic polymer cannot adsorb well to the reduced surface areas of the agglomerates due to poor wettability and adhesion, thus creating preferential sites for water absorption initiation and continuity [59-60]. In addition, the increase in TiO2 volume % could prevent the movement of the polymer segments because of the increased difficulty in forming the polymer chain arrangements thereby allowing water into the composite [61].
Scanning electron microcopy (SEM) images of the composites
The SEM images of the fractured surfaces of neat LDPE and LDPE/TiO2 composites after tensile deformation are presented in Figures 6 to 11.
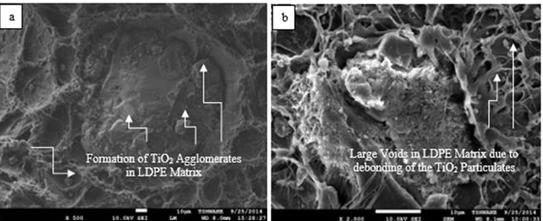
Figure 11. SEM images of post-tensile test fractured surfaces of 6.304 VPF LDPE/TiO2 composites at different magnifications (a: ×500; b: ×2000)
Figure 6 (b) reveals mirror-like fractured surface of the neat LDPE after tensile deformation which corresponds to a region of fast crack growth [61]. From Figure 9 (b) few fibrils were observed to appear on the fractured surfaces of the LDPE/TiO2 composites and large voids were observed to be present on the fractured surface of the LDPE/TiO2 composites at high VPF as shown in Figure 11 (b). Fibrils served as bridges between surfaces of crazes and they are surrounded by voids. At least six modes of failure in ductile polymers filled with very stiff fillers have been explained by Bazhenov. In the present study it was observed that the 1.261 and 2.522 VPF LDPE/TiO2 composites underwent ductile fracture while increase in VPF resulted in quasibrittle fracture of the composites as the fillers were able to suppress necking and initiated craze-like zones due to a depreciating particle-filler bonding [62]. The LDPE/TiO2 composites failed when the crazes widened and the fibrils can not withstand the applied external load further [63]. Particles have been reported to induce internal stresses in particles-filled materials because they facilitate the formation of crazes. If the particles are small as in this present study, a large number of small crazes form that grows only a short distance [64]. The resultant material has a large strength, but only a small ductility and this coincides with the large strength and low ductility of the LDPE/TiO2 composites observed in this study. In addition, the formation of voids in the composites is because of the TiO2 particulates debonding from the matrix of the LDPE. The size of the voids corresponds with the elongation at break of the materials. In materials where large voids are present as in the case of debonded agglomerates at high VPF, the strain to fracture of the material is significantly reduced as observed in this research where the strains to fracture of the LDPE/TiO2 composites varied inversely with corresponding increase in VPF. Researchers have reported that the occurrence of particle debonding often would result in a broad plastic deformation [65]. The predominant mechanism of failure in particulate-filled thermoplastics are particle-debonding by dewetting and shear yielding of the polymer matrix by crazing [66-67]. The debonding is primarily controlled by the stress of the particles and the behaviour of the particle-matrix interfacial strength. For the duration of debonding, the stress of the debonded particles is not impeded and the position of the particle is considered like a void as shown in Figure 11 (b). Combination of these voids will allow crack to propagate at faster rate as there is limited time for inducing matrix yielding after excessive particles debonding [66-67].
Water diffusion mechanism
Figure 12 shows the diffusion fitting curves of experimental data for neat LDPE and LDPE/TiO2 composites.
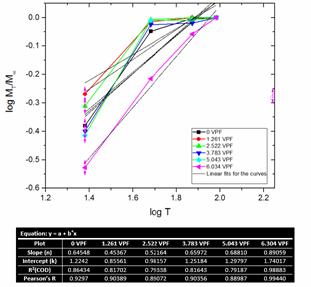
Figure 12. Diffusion fitting curves of experimental data for neat LDPE and LDPE/TiO2 composites
The values of the slope n and intercept k were calculated from the log plot. The diffusional exponent (n) ranges between 0.453 and 0.890. The n value for 1.261 and 2.522 VPF were found to be close to 0.5 which indicated that the transport mechanism of the water in the composites are Fickian diffusion; the rate of diffusion of the water molecules into the composites is much less than that of the polyethylene composite segment mobility [68]. Composites with 3.783, 5.043, and 6.304 VPF exhibited the intermediate behaviour between Fickian and less Fickian diffusion where the penetration mobility and the polymer segment relaxation are comparable [69-70]. It was also noted from Table 4 that there is a correlation between the water % absorption and diffusional exponent (n). It was observed that the water absorption rate (with respect to increase in volume % of TiO2 particulates) increases in proportion with the diffusional exponent value. It can therefore be said that the amount of water absorbed by the composites is proportional to the diffusional exponent (n), and hence influences the diffusion transport mechanism [71-72]. The linearity of the curves is presented in Figure 6 with linear fits and the degree of linearity is shown by the propinquity of the R2 (COD) and the Pearson’s R values to 1. These findings support the results observed in the water % absorption and water absorption rate of the LDPE/TiO2 composites with respect to the volume % of the TiO2 particulates.
Conclusions
From the research findings, it was observed that aside the modulus, the tensile and flexural properties of the LDPE/TiO2 composites were best improved at low VPF ranging from 1-4 VPF. The water absorption rate and water % absorption of the LDPE/TiO2 composites were best reduced at low VPF ranging from 1-3 VPF. Between 1-3 VPF the LDPE/TiO2 composites exhibit Fickian to less Fickian behaviour with respect to diffusion and water transport mechanism. Optimum combination of mechanical and hydrophilic properties was established between 1 - 3 VPF. This is a very good occurrence since TiO2 powder is more expensive than the LDPE powder used in this experiment. Therefore, it is advisable to use as little content of it as possible for economic considerations.
References
1. Dhakal H., Zhang Z., Richardson M., Effect of water absorption on the mechanical properties of hemp fibre reinforced unsaturated polyester composites. Composite Science Technology, 2007, 67, p.1674-1683.
2. Ferreira N., Capela C., Ferreira J. M., Effect of water and fiber length on the mechanical properties of polypropylene matrix composites. Fibers Polymer, 2014, 15, p.1017-1022.
3. Alomayri T., Assaedi H., Shaikh F. U. A., Effect of water absorption on the mechanical properties of cotton fabric-reinforced geopolymer composites, Journal of Asian Ceramic Society, 2014, 2, p. 223-230.
4. Espert A., Vilaplana F., Karlsson S., Comparison of water absorption in natural cellulosic fibres from wood and one-year crops in polypropylene composites and its influence on their mechanical properties. Composite Part A Appl Sci Manuf , 2004, 35 p. 1267-1276.
5. Maria S., Rosa L., Fonseca E., Studies on the properties of rice-husk-filled-PP composites - Effect of maleated PP 2. Experimental procedures. Material Research, 2009, 12, p. 333-338.
6. Khanam P. N., AlMaadeed M. A. A., Processing and characterization of polyethylene-based composites, Advanced Manufacturing Polymer Composites Science, 2015, 1, p. 63-79.
7. Yuan Z., Chen H., Tang J., A stable porous superhydrophobic high-density polyethylene surface prepared by adding ethanol in humid atmosphere, Journal of Applied Polymer Science, 2009, 113, p. 1626-1632.
8. Xu Q. F., Liu Y., Lin F. J., Superhydrophobic TiO2-polymer nanocomposite surface with UV-induced reversible wettability and self-cleaning properties, ACS Appl. Mater. Interfaces, 2013, 5, p. 8915-24.
9. Li X., Tabil L. G., Panigrahi S., Chemical treatments of natural fiber for use in natural fiber-reinforced composites: A review, J Polym Environ, 2007, 15, p. 25-33.
10. Harris E., Building scientific capacity in developing countries. EMBO Rep., 2004, 5, p. 7-11.
11. John M., Thomas S., Biofibres and biocomposites, Carbohydrate Polymer, 2008, 71, p. 343-364.
12. Oladele I. O., Olajide J. L., Agbabiaka O. G., Tensile properties and fractographic analysis of low density polyethylene composites reinforced with chemically modified keratin-based biofibres, Journal of Minerals and Materials Characterization and Engineering, 2015, 3, p. 344-352.
13. Suhaimi M. D. S. M., Ismail H., Properties of rubber seed shell flour-filled polypropylene composites: The effect of poly(ethylene co-acrylic acid), Bioresources, 2014, 9, p. 7311-7325.
14. Unal H., Findik F., Mimaroglu M., Mechanical behavior of nylon composites containing talc and kaolin, Journal of Applied Polymer Science, 2003, 88, p.1694-1697.
15. Célino A., Fréour S., Jacquemin F., The hygroscopic behavior of plant fibers: A review. Front Chemistry, 2013, 1, p. 43.
16. De Hosson J. T. M., Brebbia C. A., Surface effects and contact mechanics XI: Computational methods and experiments, Arshurst, WIT Press, 2013, p. 78.
17. Yang H. S., Kim H. J., Park H. J., Water absorption behavior and mechanical properties of lignocellulosic filler-polyolefin bio-composites, Composite Structure, 2006, 72, p. 429-437.
18. Maxwell A. S., Broughton W. R., Dean G., Review of accelerated ageing methods and lifetime prediction techniques for polymeric materials. Report 84, National Physical Laboratory, UK, 2005.
19. Gwon J. G., Lee S. Y., Chun S. J., Effects of chemical treatments of hybrid fillers on the physical and thermal properties of wood plastic composites, Composite Part A; Applied Science Manufacturing, 2010, 41, p. 1491-1497.
20. DeArmitt C., Rothon R., Fillers and surface treatment, Plastic Additional Compound, 2002, 4, p. 12-14.
21. Huang R., Xu X., Lee S., High density polyethylene composites reinforced with hybrid inorganic fillers: Morphology, mechanical and thermal expansion performance, Materials (Basel), 2013, 6, p. 4122-4138.
22. Zabihzadeh S. M., Water uptake and flexural properties of natural filler/HDPE composites, Bioresources, 2010, 5, p. 316-323.
23. Aji I., Zainudin E., Abdan K., Mechanical properties and water absorption behavior of hybridized kenaf/pineapple leaf fibre-reinforced high-density polyethylenecomposite, Journal of Composite Materials, 2012, 0021998312444147.
24. Council T. S., About titanium dioxide, www.cefic.org/Documents/Industry% /20sectors/TDMA/About-TiO2-full-version-July-2013.pdf, 2013 (accessed 03/12/2015)
25. Kuznesof P. M., Rao M. V., Titanium dioxide: Chemical and Technical Assessment, JECFA, Rome, Italy, 2006, 1, p. 1-8.
26. Shen Y., Wang L., Zhang H., Preparation and characterization of titania/silicone nanocomposite material, PMC Global conference of polymer and composite materilals, Beinjing, China, 16-18 May 2015, paper no. 012021, p. 1-6. Beinjing, IOP Publishing.
27. Sabzi M., Mirabedini S. M., Zohuriaan-Mehr J., Surface modification of TiO2 nano-particles with silane coupling agent and investigation of its effect on the properties of polyurethane composite coating, Prog. Org. Coatings 2009, 65, p. 222-228.
28. Lasko G., Burghard Z., Bill J., Simulation of mechanical properties of bio-Inspired TiO2/PE nanocomposites, Advanced Engineering Material, 2013, 15, p. 908-920.
29. Thomas R. T., Sandhyarani N., Enhancement in the photocatalytic degradation of low density polyethylene–TiO2 nanocomposite films under solar irradiation, RSC Adv., 2013, 3, p. 14080.
30. Rothon R. N., Particulate-filled polymer composites, 2nd edition, Shawbury: Smithers Rapra Publishing, 2003, p. 370-375.
31. Sombatsompop N., Chaochanchaikul K., Effect of moisture content on mechanical properties, thermal and structural stability and extrudate texture of poly(vinyl chloride)/wood sawdust composites, Polymer International, 2004, 53, p. 1210-1218.
32. Yan-Ju W., Jing C., Li-Na T., Elastic properties of rutile TiO2 at high temperature, Chinese Physics Letter, 2007, 24, pp. 2642-2645.
33. Orient HDPE, Properties compare for LDPE and HDPE, www.polymer-insulators.com/list1.asp?id=309, 2012 (accessed 03/12/2015).
34. Pukanszky B., Mudra I., Staniek P., Relation of crystalline structure and mechanical properties of nucleated polypropylene, Journal of Vinyl Addition Technology, 1997, 3, pp. 53-57.
35. Fahlman B. D., Materials chemistry, 2nd edition, Dordrecht, Springer Netherlands, 2008, p. 4-12.
36. Teegarden D. M., Polymer chemistry: Introduction to an indispensable science, Arlington, NSTA Press, 2004, p. 135-140.
37. Turng L-S., Holmes Jr L.R., Peng Y., Li X., Methods of orienting Fillers in Composite Materials, Patent 8475703-B2, USA, 2013.
38. Rösler J., Harders H., Bäker M., Mechanical behaviour of engineering materials: Metals, ceramics, polymers, and composites. New York: Springer-Verlag Berlin Heidelberg, 2007, p. 24-25.
39. Fu S. Y., Feng X. Q., Lauke B., Mai Y. W., Effects of particle size, particle/matrix interface adhesion and particle loading on mechanical properties of particulate–polymer composites, Compos. Part B Eng., 2008, 39, p. 933-961.
40. Fried J. R., Polymer science and technology, 2nd ed. Upper Saddle River: Prentice hall professional technical reference, 2003, p. 70.
41. Nielsen L. E., Landel R. F., Mechanical Properties of Polymers. 2nd ed. New York: Marcel Dekker Inc, 1994, p. 401-402.
42. Jancar J., Advances in polymer science: Mineral Fillers in Thermoplastics I. Raw materials and processing, New York: Springer-Verlag Berlin Heidelberg, 1999, p. 67-80.
43. Jordan J. L., Spowart J. E., Kendall M. J., Woodworth B., Siviour C. R., Mechanics of particulate composites with glassy polymer binders in compression, Philosophical Transactions of the Royal Society of London A: Mathematical, Physical and Engineering Sciences, 2014, 372(2015), 20130215.
44. Katz H. S., Mileski J. V., Handbook of Fillers for Plastics, New York. Van Nostrand Reinhold, 1987, p. 10-12.
45. Vaughan A. S., Gherbaz G., Swingler S. G., Abd Rashid N., Polar/non-polar polymer blends: On structural evolution and the electrical properties of blends of polyethylene and ethylene - vinyl acetate, In: IEEE conference on electrical insulation and dielectric phenomena, Kansas city, USA, 15-18 October 2006, IN SPEC acession number. 9552746, p. 272-275. Kansas: IEEE.
46. Osman M. A., Atallah A., Schweizer T., Ottinger H. C., Particle–particle and particle-matrix interactions in calcite filled high-density polyethylene—steady shear. J Rheol 2004, 48(5), p. 1167-1184.
47. Zamani A., Shelesh-Nezhad K., The effects of interphase and interface characteristics on the tensile behaviour of POM/CaCO3 nanocomposites. Nanomaterials and Nanotechnology, 2014, p. 4-17.
48. Wang W, Sadeghipour K., Baran G. Finite element analysis of the effect of an interphase on toughening of a particle-reinforced polymer composite. Compos Part A Appl. Sci. Manuf., 2008, 39, p. 956-964.
49. Mark J. E., Ngai K., Graessley W., Mandelkern L., Sumulski E., Koenig J., Wignall G., Physical properties of polymers. 3rd ed. Cambridge: Cambridge university press, 2003, p. 84.
50. Zhang S., Cao X. Y., Ma Y. M., Ke Y. C., Zhang J. K., Wang F. S., The effects of particle size and content on the thermal conductivity and mechanical properties of Al2O3/high density polyethylene (HDPE) composites. Express Polym. Lett., 2011, 5(7), p. 581-590.
51. Hartley P. A., Parfitt G. D., Pollack L. B., The role of the van der Waals force in the agglomeration of powders containing submicron particles. Powder Technol., 1985, 42, p. 35-46.
52. Lusti H. R., Karmilov I. A., Gusev A. A., Effect of particle agglomeration on the elastic properties of filled polymers, Soft Mater., 2002, 1, p. 115-120.
53. Lauke B., Effect of particle size distribution on debonding energy and crack resistance of polymer composites, Comput Mater. Sci., 2013, 77, p. 53-60.
54. Atuanya C. U., Edokpia R. O., Aigbodion V. S., The physio-mechanical properties of recycled low density polyethylene (RLDPE)/bean pod ash particulate composites, Results Physics, 2014, 4, p. 88-95.
55. Mallik A., Barik A. K., Pal B., Comparative studies on physico-mechanical properties of composite materials of low density polyethylene and raw/calcined kaolin. Journal of Asian Ceramic Society, 2015, 3, p. 212-216.
56. Xiong L. B., Li J. L., Yang B., Ti3+ in the surface of titanium dioxide: Generation, properties and photocatalytic application. Journal of Nanomaterials, 2012, p. 1-13.
57. Ardhyananta H., Ismail H., Takeichi T., Effects of organoclay loading and ethylene glycol on mechanical, morphology and thermal properties of ethylene vinyl acetate/organoclay nanocomposites, Journal of Reinforced Plastic Composite, 2007, 26, p. 789-806.
58. Berger S. B., Palialol A. R. M., Cavalli V., Characterization of water sorption, solubility and filler particles of light-cured composite resins, Braz Dent J, 2009, 20, p. 314-318.
59. Jin X., Deng M., Kaps S., Study of tetrapodal ZnO-PDMS composites: a comparison of fillers shapes in stiffness and hydrophobicity improvements, PLoS One, 2014, 9, p. 106-991.
60. Scheirs J., Compositional and failure analysis of polymers: A practical approach, New York, John Wiley & Sons, 2000, p. 304-315.
61. Bazhenov S., Mechanical behaviour of filled thermoplastic polymers, metal, ceraamic, and polymeric composites for various uses, Cuppoletti J. ed. Intechopen.www.intechopen.com/books/metal-ceramic-and-polymeric composites-for-various-uses/mechanical-behavior-of-filled-thermoplastic-polymers, 2011 (accessed 03/12/2015).
62. Lampman S., Characterization and failure analysis of plastics, Cleveland, ASM International, 2003, p. 204-206.
63. Perkins W.G., Polymers tougness and impact resistance, Bethel, Socierty of plastic engineers.www.freepatentsonline.com/article/Polymer-Engineering-Science/59176871.html, 1999 (accessed 03/12/2015).
64. Sudár A., Móczó J., Vörös G., The mechanism and kinetics of void formation and growth in particulate filled PE composites, Express Polymer Letter, 2007, 1, p. 763-772.
65. Chee C. Y., Song N. L., Abdullah L. C., Characterization of mechanical properties: Low-density polyethylene nanocomposite using nanoalumina particle as filler. Journal of Nanomaterials, 2012, p. 1-6.
66. Daramola O. O., Oladele I. O., Adewuyi B. O., Sadiku R., Agwuncha S. C., Influence of submicron agro waste silica particles and vinyl acetate on mechanical properties of high density polyethylene matrix composites, West Indian Journal of Engineering, 2015, 38, p. 96-107.
67. Bikiaris D., Panayiotou C., LDPE/Starch blends compatibilized with PE-g-MA copolymers, Journal of Applied Polymer Science, 1998, 70, p. 1503-1521.
68. Ismail H., Ragunathan S., Hussin K., Tensile properties, swelling, and water absorption behavior of rice-husk-powder-filled polypropylene/(recycled acrylonitrile-butadiene rubber) composites, Journal of Vinyl Addition Technology, 2011, 17, p. 190-197.
69. Seferis J. C., Nicolais L., The role of the polymeric matrix in the rocessing and structural properties of composite materials, New York: Plenum press, 2012, pp. 600-601.
70. George S. C., Thomas S., Transport phenomena through polymeric systems, Prog. Polym. Sci., 2001, 26, p. 985-1017.
71. Oke S. R., Omotoyinbo J. A., Alaneme K. K., Water absorption characteristics of polyester matrix composites reinforced with oil palm ash and oil palm fibre. Usak University Journal of Material Science, 2013, 2, p. 109-120.