Modeling and simulation for smart grid integration of solar/wind energy
Ali MEKKAOUI 1*, Mohammed LAOUER 2, Younes MIMOUN 3
1 Department of Electrical Engineering, University of Sidi Belabes, Algeria
2 Department of Electrical Engineering, University Center of Naama, Algeria
3Department of Electrical Engineering, University of Sidi Belabes, Algeria
E-mail(s): mekkaouiali70@gmail.com; laouer@yahoo.fr; younesmi@yahoo.fr
* Corresponding author, phone: 213055196388
Abstract
The complexity of the power grid, in conjunction with the ever increasing demand for electricity, creates the need for efficient analysis and control of the power system. The evolution of the legacy system towards the new smart grid intensifies this need due to the large number of sensors and actuators that must be monitored and controlled, the new types of distributed energy sources that need to be integrated and the new types of loads that must be supported. At the same time, integration of human-activity awareness into the smart grid is emerging and this will allow the system to monitor, share and manage information and actions on the business, as well as the real world. In this context, modelling and simulation is an invaluable tool for system behavior analysis, energy consumption estimation and future state prediction. In this paper, a Smart Grid has been designed by MATLAB/SIMULINK approach for analysis of Active Power. Analysis of active power gives the exact idea to know the range of maximum permissible loads that can be connected to their relevant bus bars. This paper presents the change in the value of Active Power with varying load angle in context with small signal analysis. The Smart Grid, regarded as the next generation power grid, uses two-way flow of electricity and information to create a widely distributed automated energy delivery network.
Keywords
Smart grids; Smart meter; Photovoltaic systems; Wind power generation, Active power
Introduction
The smart grid is the integration of the 20th century traditional electrical power grid with the most recent 21st telecommunication and information technologies. Such integration enables efficient resource utilization to optimize energy consumption, install and manage distributed energy sources, as well as to exchange the generated power. In other words, the power flow and communications will be in two-ways [1,2]. Many utility companies around the globe started to install renewable energy sources such as solar and wind energy nearby the consumption sites. Also, residential home owners started to install smart home appliances and renewable energy resources in their premises to generate and consume electrical power efficiently [3,4].
As the smart grid concepts emerged as a fast growing research and development topic in the last few years, Smart grid users communicate in two-way directions by utilizing several wireless and wired communication protocols such as Zigbee, WiFi, Homeplug, power line carrier, GPRS, WiMax, LET, Lease line, and Fibers [5,6]. Several software packages were updated and many are being developed to accommodate the new grid operation, maintenance and management such as, distribution management system (DMS), geographic information systems (GIS), outage management systems (OMS), customer information systems (CIS), and supervisory control and data acquisition system (SCADA).
As a result of the smart grid evolution, some recent enabling technologies have emerged to reduce the number of communication protocols and handle big amounts of data. The Internet of Things (IoT) is one the most recent enabler for the smart grid, shown in Figure 1 [7].
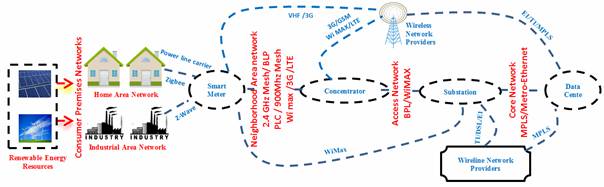
Figure 1. Smart grid communications protocols
Material and method
System description and modeling
A. Modeling and design of a wind turbine
Several studies have been reported regarding to Wind Turbine and wind generators [8]. In this study, the proposed Wind Turbine model is based on the wind speed versus Wind Turbine output power characteristics. The output power of the wind turbine is given by [9]:
|
|
(1) |
where: Pm =the mechanical output power of the turbine, Cp= the performance coefficient of the turbine, λ= the tip speed ratio of the rotor blade, β= the blade pitch angle, ρ= the air density, A = the turbine swept area, Vwind= the wind speed.
The performance coefficient model Cp(λ,β) used in this paper is taken from [9] and given by:
|
|
(2) |

where constants C1 to C6 are the parameters that depend the wind turbine rotor and the blade design. λi is a parameter given in (3).
|
|
(3) |
Furthermore, Equality (1) can be normalized and simplified for specific values of A and ρ, as in (4):
|
|
(4) |
where: Pm-pu=the
power in per unit of nominal power for particular values of A and ρ, Cp-pu=the performance coefficient Cp, ![]() =the power gain Vwind-pu of the base wind speed.
=the power gain Vwind-pu of the base wind speed.
The based wind speed is the mean value of the expected wind speed in m/s.
B. Modeling and Design of a Photovoltaic Module
The general mathematical model for the solar cell has been studied over the past three decades [10]. The circuit of the solar cell model, which consists of a photocurrent, diode, parallel resistor (leakage current) and a series resistor; is shown in Figure. 2. According to both the PV cell circuit and Kirchhoff’s circuit laws, the photovoltaic current can be presented as follows [5]:
|
|
(5) |

where: Ipv =the photovoltaic current, IGC=the light generated current, Io =the dark saturation current dependant on the cell temperature, e=the electric charge e=1.6*10-19C, K=Boltzmann’s constant, K=1.38*10-23 J/K, F=the cell idealizing factor, Tc=the cell’s absolute temperature, Vd=the diode voltage, Rp=the parallel resistance.
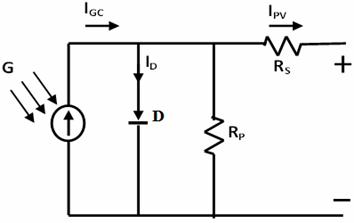
Figure 2. Single diode PV cell equivalent circuit
The photocurrent IGC mainly depends on the solar irradiation and cell temperature, which is described as [11]:
|
|
(6) |
where: μsc=the temperature coefficient of the cell’s short circuit current, Tr =the cell’s reference temperature, ISC=the cell’s short circuit current at a 25˚C and 1 KW/m2, G=the solar irradiation in KW/m2, Rs=the series resistance, D=the diode, ID=the current flowing in the diode.
Furthermore, the cell’s saturation current (Io) varies with the cell temperature, which is described as [11]:
|
|
(7) |
|
|
(8) |


where: Ioα =the cell’s reverse saturation current at a solar radiation and reference temperature, Vg=the band-gap energy of the semiconductor used in the cell, Voc =the cells open circuit voltage.
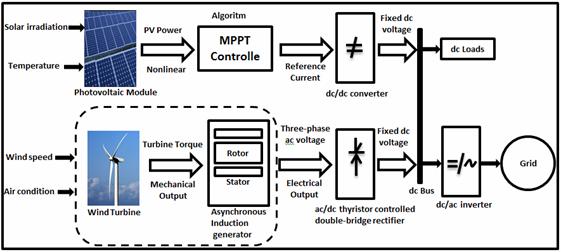
Figure 3. Block diagram of the proposed system
Description smart grid system
There are four Major parts of smart system, which will work together to overcome all those problems which are drawbacks of previous systems, these are:
1. Smart House System
2. Smart Meter
3. Town Server
4. Main Server
A) Smart house system
Smart house is a customer house which consists of smart appliances. Devices are smart due to installation of smart wireless card. The diagram of smart wireless card it consist of
1. Digital meter
2. Microcontroller
3. Sensor
4. Simple wireless card
Using the smart appliances, communication between device and smart metering will be done using small socket (SM) [11-12]. To sense power consumption sensor is used. It also decides current status while digital meter is the device which shows consumed power and its price. Microcontroller is device which controls the flow of power. And appliances required power is also known to microcontroller and send this information to SM through simple wireless card. It is ordinary connecting device that connects SM to smart wireless card through wireless communication.
B) Smart meter system (SM)
The basic purposes of SM system are [13].
(i) Power management and measuring
(ii) Unit measurement and price
(iii) Communication
i) Power management and measuring
SM is an intelligent device which has information about the total power required by smart appliances and distributes power taken from smart grid/power station accordingly [14]. If the provided power from both sources is not sufficient it will try to fulfil requirement by extracting power from RS. And if RS are unable to satisfy power requirement, SM will send a signal to TS to provide difference of required power and available power. So, if it is the case, required power is less than provided power by town server it broad cast a message to TS that TS provided power is more than require so TS can reduce power which is more than require power by SH [15].
ii) Price and unit measurement
In this part of operation, SM measures power consumption unit of 3 levels.
· Power units provided by service provider
· Power units extracted from RS
· Those which are utilized by service provider by using above mentioned readings, SM calculate price up to that time and it will be visible to customer [16].
iii) Communication
For the purpose of sending and receiving the message signal, TS is domain to communicate for SM. This is done by local public switched telephone network (PSTN). The usage of PSTN technology removes the high power radiations which are present in SM communication [17] using this communication path, SM only send those number of units and price to TS which is to finally paid by the customer to service provider. While for power transmission, SM is connected to TS via power line also. All TSs are further connected to main server using PSTN.
C) Town sever (TS)
A town server (TS) is basic unit of smart system for management. In fact, it is the central computer and a complete server which is able to take decision for all its user. The TS is connected to MS for communication only by using PSTN. As town server send calculated power units up to that time to MS after each hour so that all the data remain save at MS. while TS keeps data of current month only. It is for efficient working as long as current month passes, TS removes its data because MS have all the data of previous month and of present month up to that time. The sending of data after each hour is designed to remove the possibility of over burdening of bandwidth and also to reduce the bandwidth to considerably low level than previous smart system. The TS is operated by multitasking real time operating system and real time software which are designed for the purpose that whenever MS goes to link down state, The mode of TS automatically switch to administrative mode. In this mode TS behaves like a MS for itself and keeps to data unless MS is not linked up. While TSs are connected to each other via PSTNs and via power lines see all the management between TSs are possible through these both links so these links are of very important. As discussed in introduction the draw backs of previous system and latest needs, the one strongest reason which appeals to use PSTN is theoretically unlimited bandwidth availability. Shannon theorem gives bandwidth equation as given below [18-19]:
|
|
(9) |
where: BPS=bits per second, BW=channel bandwidth, s/n: Signal to noise ratio.
This is a real power ratio and not a db ratio. And bit per second is given by equation:
|
|
(10) |
where: Rs: symbol rate (also bandwidth for QAM), Ns =number of symbols in the constellation
Now beginning from very first point, SM sends a message to TS that its SH needs as much amount of power. In such away such messages will be received by TS from all of its SMs. Whenever the required power of SH decrease or increase, it will be informed to TS. Now if it is the case, ASM need to reduce its power and other SM need to increase its power, both broadcast a message signal to TS then TS reduces the suggested power of first one and assigned required mentioned power to other one.
If it is sufficient for the requirement of second one then its otherwise TS will check another SH whose power can be assigned. if still deficiency remain TS will check its SHs those can provide power from their regenerative sources to compensate power deficiency. If no SH can provide or SH’s power is less then it broadcast a message to its nearest TS to provide power see Figure 4. If nearest TS does not have power to donate from its own circle/ grid then it will borrow from next TS for the first one. If any problem occur at MS or any / few TSs, all the other TSs will remain working as working before see Figure 5.
This is a considerable large advantage over all other systems. TS may or may not be connected directly to smart grid or conventional power station or both. It varies from one area to area on the basis of cheap and reliable production of power in that area. The connection between TS and smart grid is same like main central computer of smart grid is connected in the smart grid system [20].
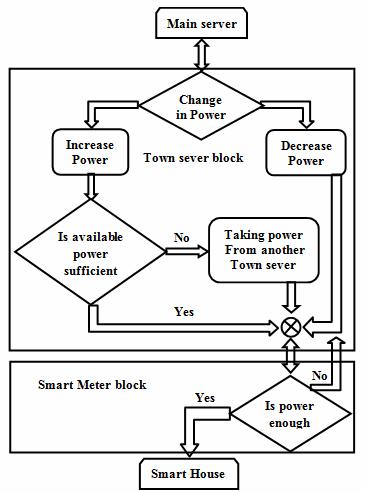
Figure 4. Flow chart of smart system
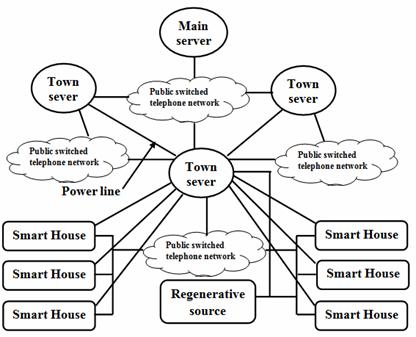
Figure 5. Topology of smart system ; upper part shows way of connection between TS and also with MS while lower part shows the way of connection of SH to TS through local PNST
D) Main server
The main server (MS) is the central device around which all the system works. It keeps measurements, bills, records, customer records, topology of division of all the power of smart grid/power stations for its town servers etc. every TS is connected to MS via PSTN only. MS is directly operated by head office of service provider. And MS is can start or stop all the functionality and working of a particular SH / TS by using some type of commands or passwords. if different distribution companies are working under single umbrella of smart system, due to any reason, service provider company can stop the working of any TS under severe conditions. MS now generates a comprehensive summary at the end of the month for each SM and for each TS. MS informs the customer about their bills and power consumption by using one of their selected media (sms, post, email etc.). It also broadcast summary of the month to the relevant TS. And also keeps record of these summaries [21].
Results and discussion
To understand the operating of the intelligent network, we will consider the following situation. Our entire system consists of two houses, two light industries and the rest of the electrical network. The set of the system was modeled for a simulation. Figure 6 illustrates the simulation block of the system under the Matlab / Simulink environment.
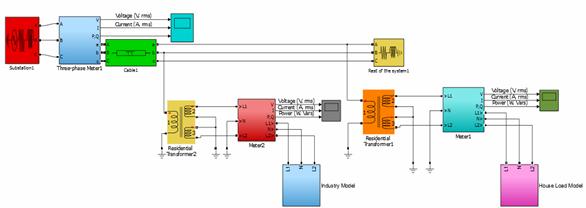
Figure 6. Bloc simulation for smart grid system
After running the simulation, we have the following results.
The first house, shown by Figure 7, is powered by two energies, wind energy of 4KW and the other of the general electricity network GEN. Its load curve is described by the following program: from 0:00 to 7:00 in the morning, the house consumes a constant electric power of 1KW supplied by the wind turbine. At 7:00 am, there is a peak of load reaching a value of 3KW, also supplied by the wind turbine. As a result, the house remains isolated from the GEN until 7.00 pm where a second peak of 5KW of power is observed and must last until 23.00. During this period the GEN intervenes to fill the gap.
Figure 7. First house simulation results
For the second house, shown by Figure 8, its load curve is given by the following program: from 00h to 06:00, it consumes a power of 1KW supplied by the GEN. A peak of power consumption of 3KW is observed and which should last 1h30mn. This power is always supplied by the GEN then the consumption will be reduced to 1.5KW following the appearance of the day when the solar energy intervenes. Thus, the GEN will be discharged of this difference until 19:00. So the GEN takes care of the consumption of the second house until 24:00.
Unlike houses, industries have very important poles of production and consumption. The first industry, shown by Figure 9, contains a 5MW wind turbine and is connected to the GEN, so it is powered by both energy sources. Its load curve is described by the following distribution: from 00h00 to 7h00 it consumes a constant power of 2MW provided by the wind turbine. At 7:30 am the arrival of the workers and the start-up of the machines of the industry, a first peak of power consumption is observed and reaches a value of 7MW. The latter can only be met by GEN assistance until 10.00 am; then the load is reduced to 5MW. The plant becomes autonomous and will be powered by its wind turbine until 13:00. At this time, a second peak is marked with the value of 6MW and which lasts until 14h00; the difference is ensured by the GEN. Then the reduction in load to 4MW frees the GEN to give the relay to its wind turbine to take charge of the consumption for the rest of the day. Knowing that after the industry closes at 17:00 the consumption is reduced to 2MW.
Figure 8. Second house simulation results
Figure 9. First industry simulation results
The second industry, shown by Figure 10, contains a solar park with a capacity of 5MW and is connected to GEN, so it is powered by both energy sources. Its load curve is described by the following distribution: from 00h00 to 6h00 it consumes a constant power of 2MW provided by the GEN.
With the arrival of the workers and the start-up of the machines of the industry, a peak of 7MW power is observed and only the GEN takes care of it. At 8:00 am where the solar energy appears and begins to provide energy, both energy are operational but solar energy cannot satisfy this demand alone, and the peak will last until 10:00. Following a reduction in power of 5MW, the GEN is released and only the solar park feeds the plant. A second peak of 6MW is observed at 15h00 and continues until 16h00, which again involves the GEN. At 5 pm, with the closure of the industry, consumption is reduced to 2MW. The latter is provided by the solar park until 19:00 with the sunset, the GEN is used again until the end of the day.
Figure 10. Second industry simulation results
Conclusion
The proposed model involves both types of solar and wind energy under normal operating conditions and explains the energy exchange between consumers and GEN. The cost of electricity is not taken into consideration, but the different consumers can choose the cheapest energy.
Abbreviations
|
Smart Grid |
SG |
|
Regenerative source |
RS |
|
Smart Meter |
SM |
|
Main server |
MS |
|
Smart House |
SH |
|
Public switched telephone network |
PSNT |
|
Town sever |
TS |
|
General electricity network |
GEN |
References
1. Anvari-Moghaddam A., Monsef H., Rahimi-Kian A., Optimal Smart Home Energy Management Considering Energy Saving and a Comfortable Lifestyle, IEEE Transactions on Smart Grid, 2015, 6, p. 324-332.
2. Han J., Choi C., Park W., Lee I., Kim S., Smart Home Energy Management System Including Renewable Energy Based on ZigBee, IEEE International Conference on Consumer Electronics (ICCE), Las Vegas, 10-13 January 2014, pp. 544-545.
3. Jaradat M., Jarrah M., Jararweh Y., Al-Ayyoub M., Bousselham A., Integration of Renewable Energy in Demand-Side Management for Home appliances, International Renewable and Sustainable Energy Conference (IRSEC), Ouarzazate, October 2014, pp. 571-576.
4. Missaoui R., Joumaa H., Ploix S., Bacha S., Managing Energy Smart Homes According to Energy Prices: Analysis of a Building Energy Management System, Original Research Article Energy and Buildings, 2014, 71, p. 155-167.
5. Garner G., Designing Last Mile Communications Infrastructures for Intelligent Utility Networks (Smart Grids), IBM Australia Limited, 2010.
6. Al-Omar B., Al-Ali A.R., Ahmed R., Landolsi T., Role of Information and Communication Technologies in the Smart Grid, Journal of Emerging Trends in Computing and Information Sciences, 2012, 3, p. 707-716.
7. Al-Ali A. R., Raafat Aburukba., Role of Internet of Things in the Smart Grid Technology, Journal of Computer and Communications, 2015, 3, p. 229-233.
8. Mellitus Okwudili Ezeme., A Multi-domain Co-Simulator for Smart Grid: Modeling Interactions in Power, Control and Communications, Master of Applied Science Department of Electrical and Computer Engineering, University of Toronto, 2015.
9. De Battista H., Mantz R. J., Garelli F., Power conditioning for a wind-hydrogen energy system, Journal of Power Sources, 2006, 155, p. 478-486.
10. Muljadi E., Butterfield C.P., Pitch-controlled variable-speed wind turbine generation, IEEE Trans. Industry Appl., 2001, 37, p. 240-246.
11. Phang J. C. H., Chan D. S. H., Philips J.R., Accurate analytical method for the extraction of solar cell model parameter, IEEE Electronics Letters, 1984, 20, p. 406-408,.
12. Villalva M.G., Gazoli J.R., E.R. Filho., Comprehensive approach to modeling and simulation of photovoltaic arrays, IEEE Transactions on Power Electronics, 2009, 24, p. 1198-1208.
13. Seyedi H., Sanaye-Pasand M., New centralised adaptive load shedding algorithms to mitigate power system blackouts, Generation, Transmission & Distribution, lET, 2009, 3(l), p. 99-114.
14. Gungor V. C., Bin Lu, Hancke G. P., Opportunities and Challenges of Wireless Sensor Networks in Smart Grid, IEEE Transactions on Industrial Electronics, 2010, 10, p. 3557-3564.
15. Shahid Bilal, Zubair Ahmed, Faroqi Adnan, Navid-ur-Rehman Rao M., Implementation of Smart System Based on Smart Grid Smart Meterand Smart Appliances, International Conference on Smart Grid Systems (ICSGS 2012) IPCSIT vol.45 © (2012) IACSIT Press, Singaporen, 2012.
16. Moslehi K., Kumar R., A Reliability Perspective of the Smart Grid. Smart Grid, IEEE Transactions on Smart Grid, 2010, l(1), p. 57-64.
17. Rashid Rozeha A., Sarijari Mohd Adib, Mohd Rozaini Abd Rahim, Tan Zun Yung., Flood Transmission based Protocol for Home Automation System via Power Line Communication, Proceedings of the International Conference on Computer and Communication Engineering, 2008.
18. Getting smart about smart meters answer book for residential customers, by POWER STREAM (Vender Company).
19. Michael Henderson., 56Kbps Data Transmission Across the PSTN, Document, 1998.
20. M. Navid-Ur-Rehman Rao, Zubair Ahmed, Faroqi Adnan, Model of Smart System Based On Smart Grid, Smart Meter and Wireless Based Smart Appliances, IOSR Journal of Electrical and Electronics Engineering, 2012, 1(5), p. 6-10.
21. Natsheh E. M., Albarbar A., Yazdani, Modeling J., Control for Smart Grid Integration of Solar/Wind Energy Conversion System, this work was supported in part by Manchester Metropolitan University, School of Engineering and An-Najah National University Department of Computer Engineering.