Bond graph modeling and control strategies in structure optimization of energy supply systems (solar hydrogen / fuel cell) for a hospital
Abd Essalam BADOUD
Automatic laboratory of Setif, Electrical engineering department, University of Setif 1, Algeria
E-mail: badoudabde@univ-setif.dz
* Corresponding author, phone: 00213 672 879 920, fax: 036 849 920
Abstract
A hybrid energy system generally consists of two or more than two renewable energy sources and energy storage components used together to provide increased system efficiency as well as greater balance in electrical energy supply. In Algeria, a photovoltaic solar energy system has been widely utilized as an alternative energy source to fossil fuel at a residential area. The output of photovoltaic cell sharply changes according to weather conditions. Therefore, a certain power storage device is required to smooth the output and to meet electricity demand equivalent to a household load. A fuel cell is a promising candidate for long term energy system because hydrogen is supplied stably. The objective of this paper was to associate photovoltaic generators, fuel cells, and electrolysers. Here, to sustain the power demand and solve the energy storage problem, electrical energy can be stored in the form of hydrogen. By using an electrolyser, hydrogen can be generated and stored for future use. The hydrogen produced by the electrolyser using phtovoltaic (PV) power is used in the fuel cell (FC) system and acts as an energy buffer. Thus, the effects of reduction and even the absence of the available power from the PV system can be easily tackled.
Keywords
Hydrogen; Fuel cell; Bond graph model; Power converter; Photovoltaic
Introduction
Nowadays, most of energy demand in the world relies on fossil fuels such as petroleum, coal, and natural gas that are being exhausted very fast. One of the major problem of global warming is the fuels combustion products, carbon dioxide, as resulting in great danger for life on our planet [1].
Fossil fuels can have as alternatives some renewable energy sources like solar, wind, biomass, and so. Among them, the photovoltaic (PV) generator converts the solar radiation into electricity, and is largely used in low power applications. The photovoltaic generator is chosen for its positive points including being carbon free and inexhaustible. Moreover, it does not cause noise for it is without moving parts and with size-independent electric conversion efficiency [2].
Hybrid power systems using renewable energy sources have received considerable attention worldwide [1, 3-11]. These systems may include different components as direct current (DC) or alternating current (AC) distribution system, storage system, converters, filters and control system for load management, which can be connected in different architectures. Most researches based on renewable hybrid system include optimization using maximum power point tracking methods, technical-economic feasibility of the hybrid power system using mathematical models in Matlab/Simulink, and on energy management in real time [12-13].
Demand for electricity and the standard of living are increasing day by day. However, power in the form of electricity is not available in plenty of remote areas like villages. Many people have worked for providing power and useful technology to remote areas and to the areas where power is not easily available.
Hospital is very important for people since many villages do not have a hospital in Algeria. If the village has, it is not having proper facilities like electricity. So if somehow electricity can be supplied to hospital in remote villages, village people could be cured without going to town or city. New technologies can be used for assisting the functioning of hospitals. Yoshida et al. [11] used rational method to determine the system structure and operational strategies for the energy supply system for a hospital based on the optimization approach. Paksoy et al. [14] designed a system using solar energy in combination with Aquifer Thermal Energy Storage (ATES) that conserved a major part of the oil and electricity used for heating or cooling the Cukurova University, Balcali Hospital in Adana, Turkey. Similarly, used different technologies for running and assisting hospitals have been reported in the scientific literature [15-18].
The aim of our study was to develop a bond graph model to design and size a hybrid system for different loadings and meteorological conditions.
System configuration
A simple model of the hybrid energy system that consists of solar photovoltaic modules, charge controller, PEM electrolyzer, gas storage cylinder, PEM fuel cell stacks and two inverters are first presented and depicted in Figure 1. When enough sunlight is available, sun rays fall on solar photovoltaic modules and generate current. Some amount of current required for hospital goes through an inverter to operate various appliances of the hospital. The excess current after meeting the requirements of the hospital goes to PEM electrolyzer. In electrolyzer water is present which gets dissociated into hydrogen and oxygen. The hydrogen gas generated in electrolyzer is stored in gas compressor. For pressurization of the hydrogen gas owing to low mass density, which requires a very large storage tank, the compressor derives its electrical energy (IG) from solar photovoltaic modules and operates only when electrolyzer is in operation.
When sunshine is not enough, deficient current comes from the PEM fuel cell stack. The hydrogen required for running the fuel cell is obtained from gas storage cylinder which gets stored during sufficient solar radiation from the electrolyzer.
Modeling
Modeling of solar photovoltaic system
The photovoltaic model studied in this work consists of a single diode for the cell polarization function and two resistors for the losses.
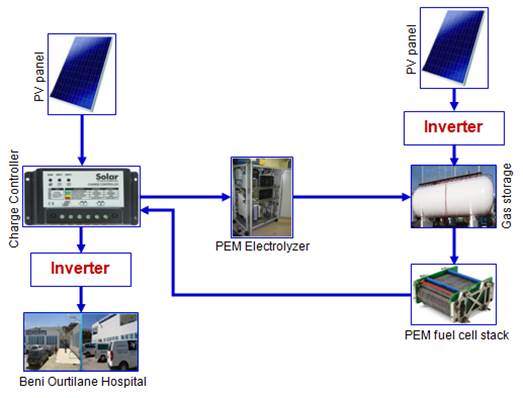
Figure 1. Schematic view of proposed integrated configuration system
The PV cell output voltage is a function of the photocurrent that is mainly determined by load current depending on the solar irradiation level during the operation [19]. The equation linking output current and voltage of this circuit is shown in equation (1) [20].
|
|
(1) |

where A is the diode ideality factor, k is the Boltzmann constant (1.38 e-23 J/K), Iph is photocurrent; ns is the connected cells in series; np is the connected PV modules in parallel; q is the electron charge (q=1.6*10-19C ); T is the temperature of solar array panel; Isatis the reverse saturation current of cell, Rs is the series resistance (Ω), Rp is the parallel resistance (Ω) of the solar cell.
The module reverses saturation current (Isat) is described in equation (2) and varies with temperature (T).
|
|
(2) |

To estimate the PV module output, the solar radiation available on the module surface, the ambient temperature and the manufacture data for the PV module was used as model inputs. The calculation method is given by equation (3).
|
|
(3) |
where Isc and Voc are the short circuit current and open circuit voltage of a solar photovoltaic module, FF (dimensionless) is the fill factor. It is the ratio between the nominal and maximum power standard.
In order to exhibit the influence of insolation and temperature, the tested scheme of PV module based on the SYMBOLS software package is constructed as shown in figure (2).
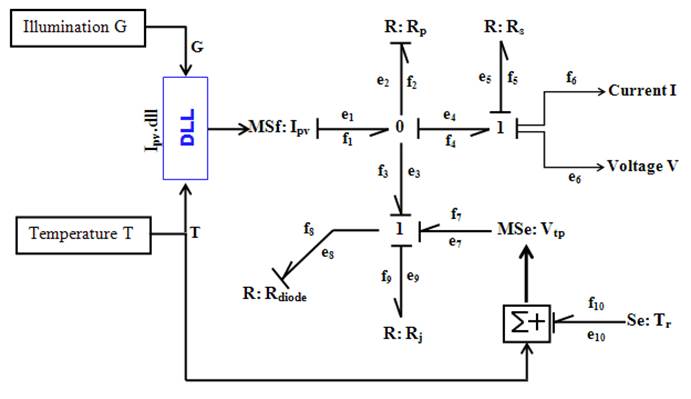
Figure 2. PV bond graph model with single diode
Modeling of proton exchange membrane fuel cell (PEMFC)
The PEMFC is an electrochemical device which allows the electric energy conversion of the chemical energy contained in a reaction between a fuel, the hydrogen, and an oxidizer, the oxygen. The temperature effects have been taken into account in the typical range of low temperature and a thermal behavior sub-model has been introduced.
The proportional relationship of the molar low of gas through a valve with its partial pressure can be expressed as:
|
|
(4) |

where KH2 is the hydrogen valve constant (KH2=4.22×10⁻⁵ kmol/atms), PH2 is the partial pressure, MH2 is the molar mass of hydrogen (kg/kmol)
For hydrogen molar low, the derivative of the partial pressure can be calculated using the perfect gas equation as follows [18]:
|
|
(5) |

where T is the fuel cell absolute temperature, R is the universal gas constant (R= 8314.47 j/kmol K)
The relationship between the hydrogen low and the FC system current can be written as [5]:
|
|
(6) |

where N0 is the number of cells, F is the Faraday’s constant (F= 96484600 C/kmol), Kr constant =N0/4*F (Kr= 2.2802×10⁻⁶ kmol/atms)The FC system consumes hydrogen obtained from the on-board high-pressure hydrogen tanks according to the power demand. A feedback control strategy is used to control hydrogen low rate according to the output power of the FC system. This feedback control is achieved where FC current how the output is taken back into the input while converting the hydrogen into molar form [18].
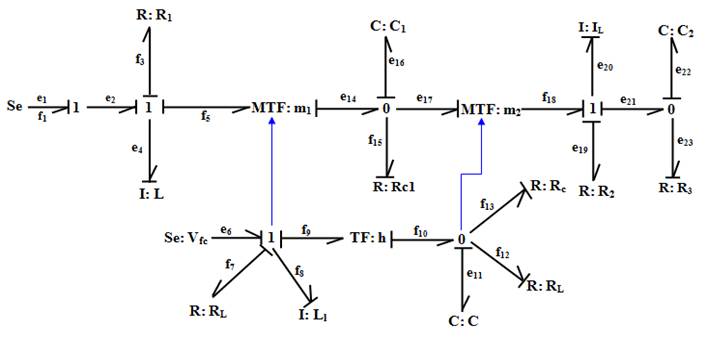
Figure 3. Bond graph model of proton exchange membrane fuel cell
Modeling of electrolyser
Electrolysis of water is the dissociation of water molecules into hydrogen and oxygen gas. The electrochemical reaction of water electrolysis is given by:
|
|
(7) |

Figure 4 shows the bond graph model of the electrolyser implemented in Bondpad.
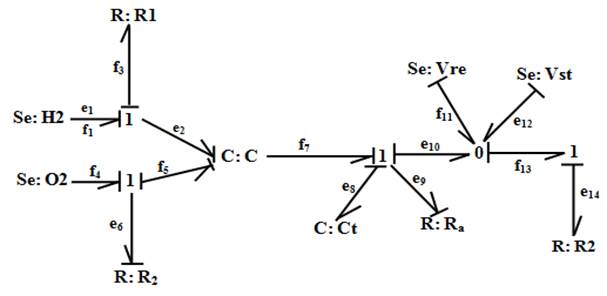
Figure 4. Bond graph model of electrolyser
The electrolyzer electrical efficiency ![]() is defined as the product of the
current efficiency
is defined as the product of the
current efficiency ![]() and voltage efficiency
and voltage efficiency ![]() given as:
given as:
|
|
(8) |
where current efficiency ![]() varies with the
current passing through the electrolyzer cells
varies with the
current passing through the electrolyzer cells ![]() and
given by:
and
given by:
|
|
(9) |

where IPV is the photovoltaic cell output current (A).
Amount of hydrogen produced (in gm mol) in electrolyzer with Nelec in one hour is given by:
|
|
(10) |

where Nelec is the number of cell in series, ![]() is the electrolyzer electrical
efficiency, F is the Faraday’s constant (F= 96484600 C/kmol).
is the electrolyzer electrical
efficiency, F is the Faraday’s constant (F= 96484600 C/kmol).
Modeling of gas compressor
Hydrogen gas produced in electrolyzer needs to be compressed. For compressing the hydrogen gas energy i.e current is obtained from solar photovoltaic modules integrated with inverter as shown in Figure 1.
Neither the compression dynamics nor the compression energy requirements are accounted for in our calculations. All auxiliary power requirements such as pumps, valves were ignored in the dynamic model. The bond graph model of the hydrogen storage is depicted in Figure 5.
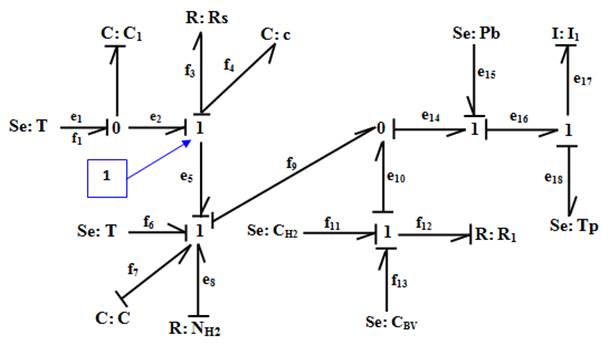
Figure 5. Bond graph model of gas compressor
Town hospital estimations
To study the climate of a region, more data are needed as humidity, sun, snow and others. Knowledge of these factors is required because it affects human activities and consumption of energy production and habits in particular. Beni Ourtilane is located to the north east of Algeria, more accurately, 530 (longitude) and 3592 North (latitude). The altitude of the city changes from 512 m to 1130 m, the average altitude is about 957 m, it is distant about 86 Km from the sea. It is located in an area characterized by cold winters with average temperatures around 8°C and relative humidity 63% and trying a hot summer with average temperatures around 38°C and can reach 43°C and above, with a relative humidity around 38%. It is confirmed that the model Capderou [1], used for the Atlas of Algeria, may well provide the distribution of radiation direct, diffuse and global radiation during the day representative months, particularly in July with small recorded errors. Table 1 shows the specification of different equipments used in the hospital.
Table 1. Operating load parameters of combined PV and electrolyzer-PEM fuel cell system
|
Equipment |
no of units |
Power consumption of each unit (W) |
Operating hours |
Power (Wh) |
|
Lights |
200 |
100 |
16 |
1600 |
|
Pump |
4 |
2000 |
2 |
4000 |
|
Fans |
120 |
65 |
15 |
975 |
|
Refrigerator |
5 |
2000 |
24 |
48000 |
Results and discussion
Table 2 presents that needed number of photovoltaic modules in parallel, which is equal with 875. The number of modules in series is given by equation 8. Electrolyzer input at 48 V is 178.537 kW which is taken at 12:00 hours (maximum radiation in a day) for the month of May because month July has the highest solar radiation and electrolyzer input will be maximum due to greater production of hydrogen by electrolyzer, hence electrolyzer which works well in May will work well throughout the year. The number of fuel cells in a stack in series is 47.
Table 2. Rating of power system components
|
Components of power system |
Rating |
|
Number of photovoltaic modules in parallel |
875 |
|
Number of photovoltaic modules is series |
2 |
|
Electrolyzer input at 48V (kW) |
178.537 |
|
Number of fuel cell in a stack (series) |
47 |
|
Number of fuel cells stacks (parallel) |
27 |
|
Maximum output of each fuel cell stack (W) |
382.372 |
|
Gas compressor rating at 48V (kW) |
14.234 |
|
Number of photovoltaic modules in parallel for gas compressor |
123 |
|
Number of photovoltaic modules in series for gas compressor |
2 |
Figures 6 to 9 showed hourly current consumption (load current Ah) throughout the day for running the appliances of the hospital. In all the figures it is seen that current consumed in Ah from 19h00 to 8h59 is 190.59 Ah per hour. Similarly, current consumed from 9h00 to 10h59 is 297.44 Ah per hour; 11h00 to 18h59 is 102.37 Ah per hour. The current consumption will be same for all the months due to the operation of the same number of equipments for the same number of hours shown in Table 2 for all the different months i.e. January, March, July, and October.
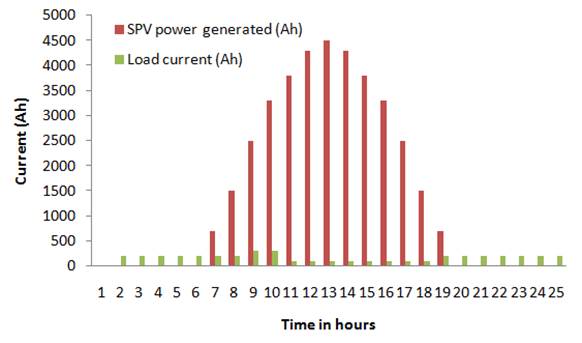
Figure 6. Electrical load variation for the month of July
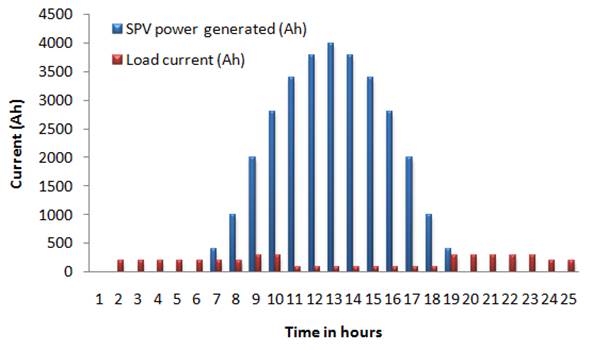
Figure 7. Electrical load variation for the month of March
Based on the analysis of figures from 6 to 9, it is seen that months March and October have the same pattern of SPV power generation due to the same amount of solar radiation values from 8h00 hours to 19h59 hours. Month July has highest SPV power generation due to the availability of maximum solar radiation in a year. Month January has lowest SPV power generation due to the availability of lowest solar radiation in a year. The SPV power generated is almost same at 8h00 hours and 19h59 hours in figures 6-9 due to the same value of solar radiation at 8h00 hours and 19h59 hours.
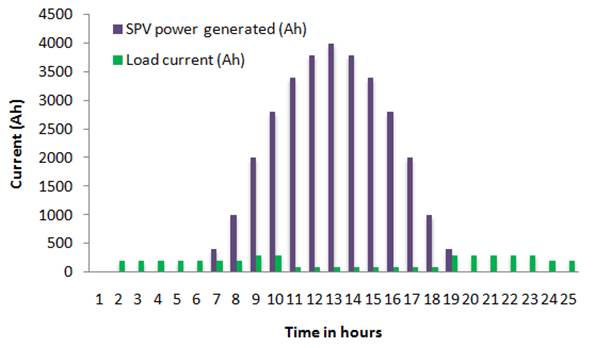
Figure 8. Electrical load variation for the month of October
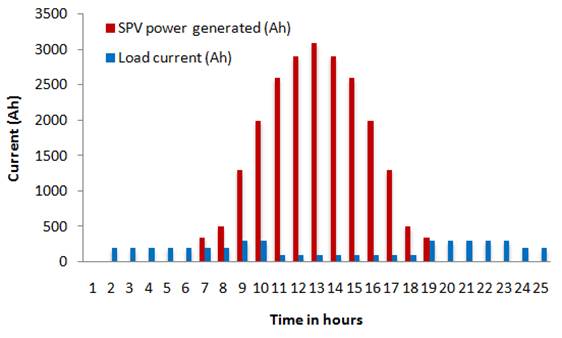
Figure 9. Electrical load variation for the month of January
The hydrogen consumption (gm mole/hour) by fuel cell stacks are depicted in Figures from 10 to 13. Hydrogen consumption (gm mole/hour) is same for all the months due to the reason mentioned earlier by fuel cell stacks during non-sunshine hours from 23h59 hours until 7h00 hours is 420.22 gm mole/hour and 21h00 hours until 23h59 hours is 531.76 gm mole/hour.
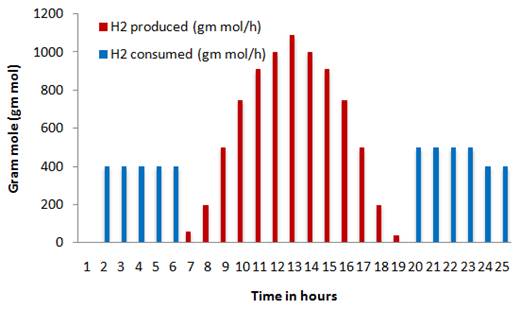
Figure 10. Hydrogen consumption and production pattern for the month of March
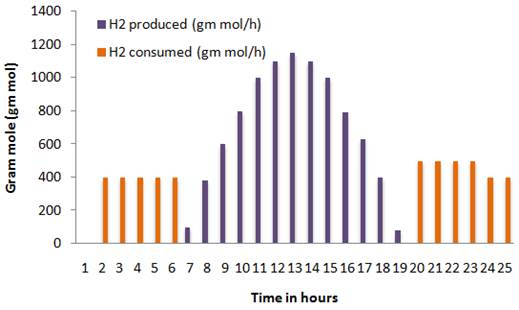
Figure 11. Hydrogen consumption and production pattern for the month of July
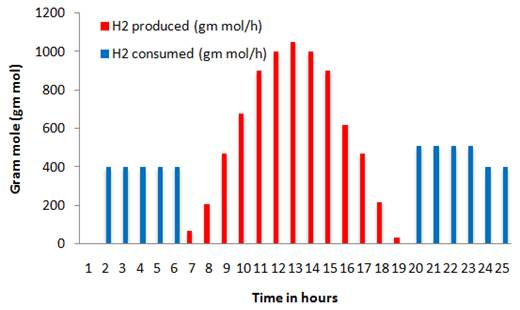
Figure 12. Hydrogen consumption and production pattern for the month of October
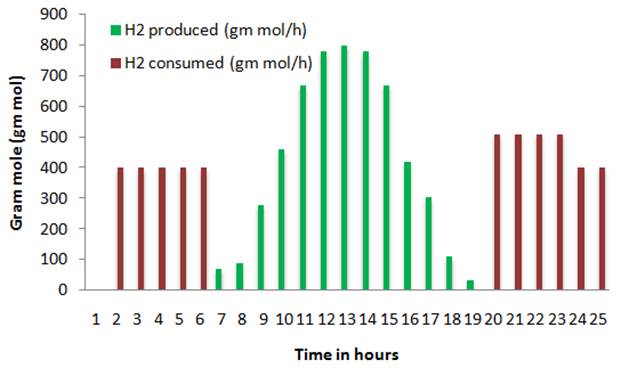
Figure 13. Hydrogen consumption and production pattern for the month of January
Figures 10-13 also showed hydrogen production (gm mole/hour) by electrolyzer from the current generated by photovoltaic modules during sunshine hours (i.e. from 8h00 hours to 20h00 hours). It is seen that hydrogen production increases from 8h00 hours to 14h00 hours and decreases to 20h00 hours. It is due to the fact that solar radiation increases from 8h00 hours to 14h00 hours and again decreases to 20h00 hours. Thus more solar radiation means more amount of current being generated by utilizing to produce more hydrogen by given electrolyzer after meeting the hospital’s current requirements.
Based on the analysis of Figures 10-13 it is seen that months March and October have the same pattern of hydrogen generation due to the same reason mentioned earlier in Figures 6-9 for SPV power generation. Month July has highest hydrogen generation and month January has lowest hydrogen generation due to the same reason mentioned in Figures 6-9 for SPV power generation.
Because of the lack of funding, this study was solely based on simulation. Future study can also integrate and compare the results of this paper with experimental results.
A bond graph control model suitable for each control problem is developed from physics-based principles. Not only are they easily callable and expandable, but the system level dynamic models built from physics-based component models are also very useful in understanding system behaviors and interactions and in designing the model-based controller. Bond graph models were obtained for different subsystems present in hybrid solar hydrogen/fuel cell for running a hospital. Even though this study is incomplete, bond graph models allow the observation of important characteristics of the subsystems, due to a simple and compact graphical representation.
In this study, we focus on the control of the cathode oxygen supply. For this purpose, a proportional controller for the hydrogen flow and an ideal controller for the humidifier are incorporated into the FCS model. The hydrogen flow control ensures a minimum pressure difference between the anode and the cathode channels while the humidifier control ensures a fixed humidity of the air entering the stack.
In the present work appliances of a hospital located in a remote area in Algeria is operated with the integrated system of solar photovoltaic and electrolyzer-polymer electrolyte membrane fuel cell. It is seen that cumulative hydrogen generation in electrolyzer is more than hydrogen consumption in PEM fuel cell stack of four different months of a year.
Conclusion
Bond graph models were obtained for different subsystems present in hybrid solar hydrogen/fuel cell for running a hospital. Even though this study is incomplete, bond graph models allow the observation of important characteristics of the subsystems, due to a simple and compact graphical representation.
References
1. Giannakoudis G., Papadopoulos A. I., Seferlis P., Voutetakis S., Optimum design and operation under uncertainty of power systems using renewable energy sources and hydrogen storage, International journal of Hydrogen energy, 2010; 35, p. 872-891.
2. Lwis M., Heam C., Feng X., Hanlin J., Levin J., Ambrosio J., Guggenheim P., Walker C., Design and modeling for hydrogen fuel cell conversion of parcel delivery trucks, Transportation electrification conference and expo (ITEC), 22-24 June 2017, Chicago, IL, USA.
3. Wai R. J., Jhung S. J., Liaw J. J., Chang Y. R. Intelligent optimal energy management system for hybrid power sources including fuel cell and battery, IEEE Trans Power Electron 2013; 28(7), p. 3231-3244.
4. Yazic M. S., Yavasoglu H. A., Eroglu M., A mobile off-grid platform powered with photovoltaic /wind / battery / fuel cell hybrid power systems, International Journal of Hydrogen Energy, 2013 38(26), p. 11639-11645.
5. Bizon N., Load-following mode control of a standalone renewable / fuel cell hybrid power source, Energy Convers Manag, 2014, 77, p. 763-772.
6. Görgün H., Dynamic modelling of a proton exchange membrane (PEM) electrolyzer, International Journal of Hydrogen Energy, 2006, 31(1), p. 29-38.
7. Sukamongkol Y., Chungpaibulpatana S., Ongsakul W., A simulation model for predicting the performance of a solar photovoltaic system with alternating current loads, Renewable Energy, 2002, 27(2), p. 237-258.
8. Rekioua D., Bensmail S., Bettar N., Development of hybrid photovoltaic-fuel cell system for stand-alo ne application, Int J Hydrogen Energy, 2014, 39(3), p. 1604-1611.
9. Ghoddami A., Delghavi B. M., Yazdani A., An integrated wind photovoltaic battery system with reduced power-electronic interface and fast control for grid-tied and off-grid applications, Renew Energy, 2012, 45, p. 128-137.
10. Wang C., Nehrir M. H., Power management of a stand-alone wind / photovoltaic / fuel cell energy system, IEEE Trans Energy Convers, 2008, 23(3), p. 957-967.
11. Yoshida S., Ito K., Yokoyama R., Sensitivity analysis in structure optimization of energy supply systems for a hospital, Energy Conversion and Management, 2007, 48, p. 2836-2843.
12. Okundamiya M. S., Emagbetere J. O., Ogujor E. A., Techno-economic analysis of a grid-connected hybrid energy system for developing regions, Iranica J. Energy Environ., 2015, 6, p. 243-254.
13. Banjo A. A., Daniel Chowdhury S. P.,Thomas O. O., Adnan M. A., Techno-economic feasibility of hybrid solar photovoltaic and battery energystorage power system for a mobile cellular base station in soshanguve, South Africa, Energies, 2018, 11, p. 1-26.
14. Paksoy H. O., Andersson O., Abaci S., Evliya H., & Turgut B. Heating and cooling of a hospital using solar energy coupled with seasonal thermal energy storage in an aquifer, Renewable Energy, 2000,19, p. 117-122.
15. Bizzarri G., Morini G. L., Greenhouse gas reduction and primary energy savings via adoption of a fuel cell hybrid plant in a hospital, Applied Thermal Engineering, 2004, 24, p. 383-400.
16. Bizzarri G., Morini G. L., New technologies for an effective energy retrofit of hospitals, Applied Thermal Engineering, 2006, 26, p. 161-169.
17. Al Karaghouli A., Kazmerski L. L., Optimization and life-cycle cost of health clinic PV system for a rural area in southern Iraq using HOMER software, Solar Energy, 2010, 84, p. 710-714.
18. El-Sharkh M. Y., Rahman A., Alam M. S., Byrne P. C., Sakla A. A., Homas T., A dynamic model for a stand-alone PEM fuel cell power plant for residential applications, Journal of Power Sources, 2004, 138(1-2), p. 199-204.
19. Picault D., Raison B., Bacha S., Aguilera J., De La Casa J., Changing photovoltaic array interconnections to reduce mismatch losses: a case study, in proceeding of International Conference on Environment and Electrical Engineering, Prague, Czech Republic, 2010.
20. Kaushika N. D., Gautam N. K., Energy Yield Simulations of Interconnected Solar PV Arrays, IEEE Transactions on Energy Conversion, 2003, 18(1), p. 1243-1250.