Assessment of engineering properties of soils: A case study
Buba Apagu ANKIDAWA1*, Clement OMEPA1, Sam Baba ONOJA2
1Department of Agricultural and Environmental Engineering, School of Engineering and Engineering Technology, Modibbo Adama University of Technology, PMB 2076, Yola, Nigeria
2Department of Agricultural and Environmental Engineering, University of Agriculture Makurdi, PMB 2373, Makurdi, Benue State, Nigeria
E-mail(*): ankidawa03@yahoo.com
* Corresponding author, phone: +2348063124156
Abstract
Engineering properties of soils is useful in understanding the properties and behaviour of soils for the management especially erosion control, farming activities, building, etc. The present research was aimed to assess the engineering properties and behavior of the soils in Otukpo local Government Area of Benue State. The engineering properties such as Atterberg limits (e.g., shrinkage limit, liquid limit and plastic limit), bulk density, dry density and optimum moisture content, particle size distribution within were determined from four districts in the Local Government Area. The samples collected from three different points in each district were mixed together and analysed in the SCC Nigeria limited control laboratory. Four samples were analysed, one from each district of Akpa, Uga, Ogboju, and Otukpo respectively. It was observed that Otobi and Obotu soils are uniformly graded, while the Owetor soils are well-graded while Uga soils are gap-graded. The obtained results indicate that the soils in the four districts are plastic. It was seen that the erosion menace in Otobi is not as a result of the nature of the soil. The problem may be due to management problem or poor cultural practice. The waterlogging menace was discovered to be due to high plasticity and fines nature of the soils in the research area. These reduce the infiltration capacity of the soil and eventually control soil erosion problems in the research area.
Keywords
Particle size distribution; Bulk densities; Stability; Infiltration; Plasticity
Introduction
Geologists and engineers classified deposits of earth’s crust into “soil” and “rock [1]. The thin layer of soil that covers most of the earth’s land surface varies from a few centimeters to 2 or 3 meters in thickness [2]. The distribution of soils on earth surface varies from one location to the other [3]. Soil is a mixture of minerals, organic matter, gases, liquids and a myriad of organisms that can support plant life. According to [4] soil particles is considered the “skin of the earth” with interface between the lithosphere, hydrosphere, atmosphere and the biosphere. Soil consists of a solid phase (minerals and organic matter) as well as a porous phase that holds gases and water. Soil is the end product of the influence of the climate, relief (elevation, orientation and slope of terrain), biotic activities and parent materials (minerals) acting over periods of time. Soil continually undergoes development by way of numerous physical, chemical and biological processes which include weathering with associated erosion. Most soils have density between 1 g/cm3 to 2 g/cm3 [5]. It is a mixture of minerals matter produced by the weathering of bedrock, other parent material (e.g. glacial till) and organic matter supplied by the plant. These materials are changed by continued weathering, downward leaching through infiltrating rainwater, and mixing via animal activities as studied by [6]. Soil is one of the most valuable and dependable resources on the earth surface, it is however not a renewable resource. Thus the need for a proper understanding of the soil is by studying it engineering properties.
It is pertinent to provide baseline soil information, evaluate landscape effects on soil quality, provide data for modelling and monitoring changes in soil quality with time, and also provide well-documented site report for future integrated research programmed and evaluated sustainability, in order to achieve the aforementioned goals, efforts have been made to observe changes in soil as a result of human activity. More so monitor their changes and identify the causes of such variations to improve on and implement a soil preservation policy [3, 5, 7] showed that classification is used to provide guideline information for regional development and is useful for national purpose. Characterization and classification is based on morphological, physical and chemical properties. These properties determine those soil types. Soil properties being about the understanding of some of these soil, thus ensure their rational use. It provides an improved framework of reference for soil scientist and engineers in all parts of the work and an easier language of communication between them. [8] reviewed many recent finding and investigation emphasized the importance of soil type’s properties studies. They conclude that it is very helpful in understanding remembering the properties and behaviour of soil and that it enable people to determine the response of soil to management and manipulation. Soil studies provide detailed information about soil within a given area which could be useful for other purposes e.g. farming activities or building structures [9, 10]. It is required for a more effective agronomy and conservation utilization of the soil for soil correlation purpose in detailed soil survey. Also having soil placed into groups or types having similar form and appearance allows onto deduce some properties about soil in that group. Thus, it helps in the study of soil variation that exists in different climatic and topographic environment. This research work is aimed at assessing the engineering properties and the behavior of the soils in order to solve the erosion problems, farming activities, building, etc., in Otukpo local Government Area of Benue State.
Material and method
The study area
Otukpo is a Local Government Area of Benue State. It was created in 1976 by the Presedent Yakubu Gawon administration with headquarters at Otukpo. It has four districts namely Akpa, Otukpo, Adoka and Ogboju, and a total of 13 wards. Otukpo Local Government shares common boundaries with Apa to the north, Ohimini to the southeast, Ado to the south, Olamaboro to the west. The Local Government has an approximate landmass of about 390 km2 and lies at the intersection of latitude 7o and 7o30’ North and longitude 8º00’ and 8º30’ East. The inhabitants are the Idoma speaking people who are mainly farmers. The population of the research area is 261,666 persons [11]. The Local Government is characterized by both plain land mass and hilly features. The Local Government is characterized by two season’s namely wet and dry seasons which run from April to October and November to March respectively. The mean annual rainfall range is between 1,550 mm and 2,200 mm and the temperature ranges from 23 to 37 °C. The soil is mostly dark brown clay with thin sheet of sand loamy soil covering it. It has laterite and shale in traces. The engineering properties of the soil in Otukpo region will be better understood so as to achieve and harness more purposely and better land use in the areas related to urban and rural land uses such as construction, Agriculture and high ways.
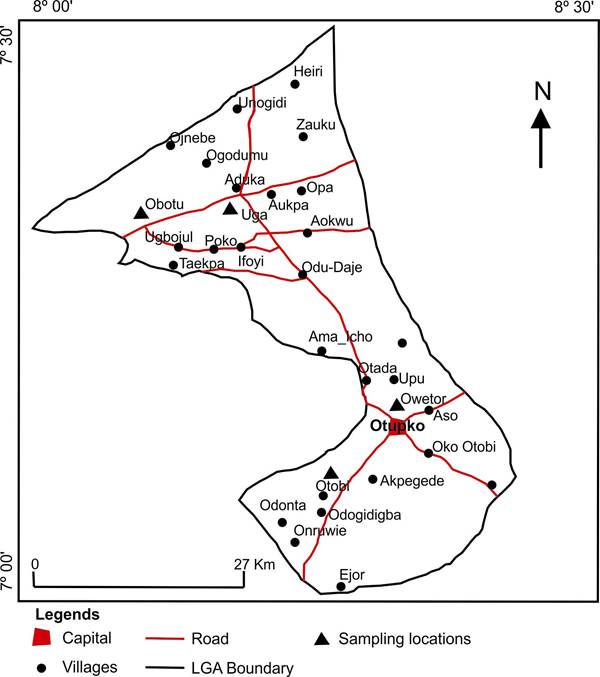
Figure 1. Map of the Study Area Showing Sampling locations
Geology of the research area
The area is underlain by the Cretaceous sediments of the Benue Trough; located in the Southern area of Benue valley. Lower Cretaceous sediments are presumed to overlie Precambrian basement rocks un conformably along the Benue valley [12]. Alluvia deposits are found in traces in some low-lying areas such as floodplain where dry season irrigation activities are taken place [13]. These consist of gravels, sand, silts and clays [14]. They are no major highlands in the area. The Local Government Area is drained by Okpokwo stream which flows across the area. The land of the area is mostly used for agricultural activities. Otukpo Local Government Area is known for rice, yam, cassava, guinea corn and maize production. The Local Government Area also has rich forest reserves hence the presence of many saw mills in the area. The Local Government Area has large deposits of kaolin (clay mineral) with the potential for commercial exploration in addition to the large deposit of clay soil which has given rise to clay brick cottage industries the area.
Figure 2. Geological map of the research area, Adapted from [15]
Methods
The soil samples, which were used in this project work, were collected from four different locations (Otobi, Obotu, Uga, and Owetor) in Otukpo Local Government Area. At each location, three samples were collected at 0.4 m, 0.7 m and 1.0 m below the soil surface, which make up of twelve soil samples collected. The samples were obtained from erosion and agricultural areas of the four locations. The samples were transported from the field to the laboratory in polyethylene bags. The three samples from each location were thoroughly mixed together before tests were carried out on them. Materials used for analyses were obtained from the quality control laboratory of SCC Nigeria Ltd, Otukpo multipurpose dam project site.
Determination of particle size distribution
Soil samples of 500g were oven-dried and weighed. The soil particles were pulverized using the pestle and mortar. The mass of sample was determined accurately, Wt. (g). A stack of 11 sieves was then arranged (this was done to obtain all the grain sizes). Sieves having larger opening sizes were placed above the ones having smaller opening sizes and a pan was placed under it to collect the portion passing 75 μm. It was ensured that sieves were clean; the sieves openings were cleaned using brush. All the sieves and the pan were weighed separately. The soils from step 3 were poured into the stack of sieves from the top and the cover was placed over it. With the stack of sieves placed on the sieve shaker and the clamps fixed, the time adjusted to 10 minutes. The automatic sieve shaker was then put on. Each sieve and pan with the soil retained on each sieve was obtained by subtracting the weight of the first step from the weight of the last step. The sum of the retained weight was checked against the original soil weight. Similar step was also used by [16] to analysed particle size distribution on beach river sand in lagos, Nigeria.
Determination of moisture content
The aim of this experiment is to determine the amount of water present in a quantity of soil in terms of its dry weight. The water content, W of a soil mass, was estimated from the formula.
W = Ww/Ws×100 (1)
where Ww is weight of water present in the soil mass, Ws is weight of solid soil
Determination of shrinkage limits
The shrinkage limit (SL) is the water content where further loss of moisture will not result in any more volume reduction. The sample was made into paste and put the shrinkage limit mould. The mould was put beside an oven for 24 hours after which the length was measured. The shrinkage limit (SL) was then determined using the following formula:
SL = 1-[(final length)/(initial length)]×100 (2)
where SL is Shrinkage limit
The procedure was repeated for all the samples. The test to determine the shrinkage limit according to ASTM International D4943 standard. The shrinkage limit is much less commonly used than the liquid and plastic limits [17].
Determination of plastic limit
The plastic limit was determined by rolling out a thread of the fine portion of a soil on the flat, non-porous surface. The procedure used according to ASTM Standard D 4318. If the soil is plastic, this thread will retain its shape down to a very narrow diameter. The sample was then remolded and the test repeated. As the moisture content fell due to evaporation, the thread began to break apart at larger diameters. The plastic limit is defined as the moisture content where the thread breaks apart at a diameter of 3 mm (about 1/8”). A soil is considered non-plastic if a thread cannot be rolled out down to 3mm at any moisture.
Determination of liquid limit
The liquid limit (LL) is the water content at which a soil changes from plastic to liquid behavior. The liquid limit test of Atterberg’s involved mixing a part of clay in a cup of Atterberg limit machine. A groove was cut through the paste of clay with a spatula and the machine was put on until the groove closed at 12 beat. A sample was taken and kept in the oven. The step was repeated for three more values.
Compaction test
The test was performed using B.S. light compaction on soil containing particles not larger than 20 mm. The soil was prepared to provide a single sample of about 2.5 kg and the moisture content was adjusted to the deserving starting value. The CBR mold was filled with the soil and the soil compacted by applying 27 blows of the rammer dropper from the controlled height of 250 mm and the rammer was moved progressively around the edge of the mold between successive blows so that the blows were uniformly distributed over the whole area. Secondly, approximately equal layer of soil was placed in the mold and compacted with 27 blows as before, the procedures were repeated until the soil has compacted in fine equal layers. The extension collar was then removed carefully from the mold, checking with the straight edge. The base plate of the mold was trimmed and the soil and the mold were weighed to the nearest 1 kg. The soil was then removed from the mold and broken up on a tray. A second approximately equal sample of soil was placed in the mold and compacted with 25 blows as before. The procedure was repeated until the soil was compacted in fine equal layer. The extension was carefully removed and the excess soil was cut away and level off to the top of the mold, checking with the straight edge [18]. The base plate was removed carefully and the soil at the lower end of the mold was trimmed and the soil, mold was weighed to the nearest 1 kg.
Determination of bulk density
Soil bulk density is the ratio of the mass of the soil to volume of soil. The unit of measurement is in grams per cubic centimeter. The bulk density was determined using cylinder core of a known diameter and height. The core samples were carefully driven into the soil until it is levelled with soil surface and undistributed soil samples were taken. The soils at the top and bottom of the cave were carefully drained so that all dense soils were inside the core. The soil was then carefully transferred into a label container while moist soils were dried at 110 °C for 24 hours to constant weight. The bulk density (ɣ) for the soil samples was determined using the formula below.
ɣ = (mass of soil)/(volume of soil) (3)
where ɣ is Bulk density in (g/cm3)
Statistical analysis
The results obtained were subjected to statistical analysis using Microsoft Excel and SPSS version 16.0 software.
Results and discussions
The result obtained from the sieve analysis on the soil samples is presented in Fig. 3. Obotu and Uga have similar soil properties, while Otobi and Owetor have similar soil properties (Fig. 3). Generally, sieve analysis result shows similarity in the particle size distribution of soils in the research area. It is seen that Owetor soils are well-graded; Otobi and Obotu soils are uniformly graded, while Uga soils are gap-graded. Table 2 presented results of the particle size analysis obtained from the four districts i.e. Otobi, Obotu, Uga and Owetor in Otukpo Local Government Area. The particle size distribution results shows that, Otobi consists of clay-silt-sand soils, Obotu consists of sandy-clay-silt soils, Uga consists of sandy-clay-silt soils and Owetor consists of clay-silt-sand soils. It can be observed that Otobi and Owetor have similar particle size distributions, while Obotu and Uga have similar particle size distribution. Table 2 presented results of moisture content, bulk density and dry density for the soil samples in the research area. The moisture content ranges from 8.53% to 14.6%. The lowest moisture content was observed in Uga, while the highest moisture content was observed in Owetor. Table 3 presented results of Atterberg limit analysis, the results that, the soils in the research area are plastic in nature. Study by [2] though not in the same region, however show some similarity in the particle size distribution in their research area.
Figure 3. Results of Sieve analysis for the soils in the research area
From the graph of the sieve analysis, it is seen that Owetor soils are well-graded; Otobi and Obotu soils are uniformly graded, while Uga soils are gap-graded. The soils in the four locations are plastic. Owetor has the highest plasticity of 32% while Obotu has the lowest plasticity index of 22%. The plasticity follows this order: Owetor>Otobi>Uga>Obotu. This may be the reason for the waterlogging in Owetor. Owetor has the highest percentage of fines (clay and silt) while Uga has the least fines. These fines are capable of blocking the soil pores thereby reducing infiltration and increasing runoff and consequent accumulation of water on the soil surface where there is poor drainage system. This justifies the waterlogging menace of Owetor area of Otukpo. The range of the percentage of fines for the four locations follows this order: Owetor>Obotu>Otobi>Uga. As the particle size decreases, the erodibility of the soil also decreases. This does not justify the erosion problem in Otobi since the erosion problem in Uga whose soils are coarser than that of Otobi is not as high as that of Otobi. The erosion problem in Otobi may be due to poor land use.
Table 1. Results of particle size distribution analysis for the soil samples
|
Locations |
Depth (m) |
Sand (%) |
Fines (silt and clay) (%) |
Soil type |
|
Otobi |
1.5 |
32.6 |
39.8 |
clay-silt-sand |
|
Obotu |
1 |
54 |
41.6 |
sandy-clay-silt |
|
Uga |
1 |
59 |
26.6 |
sandy-clay-silt |
|
Owetor |
1 |
35.8 |
49 |
clay-silt-sand |
Owetor has bulk density of 1.83 g/cm3, Obotu has 1.75 g/cm3 bulk density, Otobi has 1.67 g/cm3 bulk density while Uga has 1.71 g/cm3 bulk density. These bulk densities seem to be on the high side but it is justified by the fact that the test was done in the dry season when the soil particles were closely packed because during dry season, the air void reduces in volume as water and air get heated and escape from the soil (soil particles then occupy the volume left behind). Owetor soils are the most closely packed while that of Otobi are the most loose. This gives a hint about the erodibility of Otobi soil and hence the erosion problem in the area. Table 4.5 gives the natural moisture content of the four locations in the following order: Owetor>Otobi>Obotu>Uga. Owetor and Otobi soils are loamy while Uga and Obotu soils are sand loamy. The consistency results showed that the soils are plastic. Hence, the soils are expansive in nature. This means that the soil expands and shrinks with changes in temperature and moisture content. Sharp change in temperature and moisture content will cause the soil to expand or shrink non-uniformly. This will cause the soil to crack and consequent failure of the structure, the consistencies of the soil indicate fineness of the soil as reported by [19, 20].
Table 2. Results of moisture content, bulk density and dry density for the soil sample analysis
|
Locations |
Moisture Content (%) |
Bulk Density (g/cm3) |
Dry Density (KN/m3) |
|
Otobi |
10.2 |
1.67 |
1.94 |
|
Obotu |
10.17 |
1.75 |
1.81 |
|
Uga |
8.53 |
1.71 |
1.73 |
|
Owetor |
14.6 |
1.83 |
1.97 |
From the compaction test result, Otobi has optimum moisture content of 14.8% and maximum dry density of 1.94 KN/m3, Obotu has 14.3% optimum moisture content and 1.81 KN/m3 Maximum dry densities, Owetor has 11.9% optimum moisture content and 1.97 KN/m3 maximum dry densities while Uga has 18.1% optimum moisture content and 1.73 KN/m3 maximum dry densities. This means that the possible degree of compaction for Otobi, Obotu, Owetor, Uga soil is attained at 14.8%, 14.3%, 11.9% and 18.1% respectively. From this, it can be said that Owetor soil is best for construction because it will have higher degree of compaction (i.e. it has the highest maximum dry density). This can also be seen from the bulk density result.
Table 3. Results of atterberg limits analysis such as liquid limit, plastic limit and plasticity index for the soil samples
|
Locations |
Liquid Limit (%) |
Plastic limit (%) |
Plasticity Index %) |
|
Otobi |
53 |
28 |
25 |
|
Obotu |
47 |
25 |
22 |
|
Uga |
44 |
21 |
23 |
|
Owetor |
70 |
38 |
32 |
Table 4 show the correlation matrix for the soil properties of the research area. If can be observed sand is negatively correlated with bulk density with correlation values r = -0.969. Suggesting that sand distribution in the research area have less or non-bulk density. Moisture content have strong positive correlation with liquid limit and plastic limit with the correlation values ranged from r = 0.977 to 0.98. Similar correlation was carried out by [21, 22] in there study and show negative and positive correlations among soil properties. Liquid limit shows strong positive correlation with plastic and plasticity index, with the correlation values ranges between 0.992 to 0.980 (Table 4) this shows that the soils in the research area are less in erosion problems. However, it will only experience flooding problems and this could be prevented by providing drainage Channel to drain asses water.
Table 4. Correlation matrix for soil properties of the research area
|
Parameters |
Depth |
Sand |
SC |
MC |
BD |
DD |
LL |
PL |
PI |
|
Depth |
1 |
|
|
|
|
|
|
|
|
|
Sand |
-0.649 |
1 |
|
|
|
|
|
|
|
|
SC |
0.039 |
-0.689 |
1 |
|
|
|
|
|
|
|
MC |
-0.173 |
-0.636 |
0.878 |
1 |
|
|
|
|
|
|
BD |
-0.683 |
-0.108 |
0.650 |
0.836 |
1 |
|
|
|
|
|
DD |
0.460 |
-.969* |
0.841 |
0.793 |
0.334 |
1 |
|
|
|
|
LL |
-0.029 |
-0.738 |
0.817 |
.977* |
0.731 |
0.852 |
1 |
|
|
|
PL |
0.000 |
-0.761 |
0.882 |
.984* |
0.726 |
0.883 |
.992** |
1 |
|
|
PI |
-0.074 |
-0.678 |
0.686 |
0.934 |
0.714 |
0.773 |
.980* |
0.947 |
1 |
Conclusions
Our results showed that the soils from the four districts in Otukpo Local Government Area of Benue State are plastic in nature (since all the soils could be rolled into thin thread of about 3 mm and have plastic limits). This type of soil controls the problems of erosion particularly the research area. Owetor, Otobi, Uga and Obotu have plastic limit of 38%, 28%, 21% and 25% respectively. The relative compaction of the soils follows this order: Owetor>Obotu>Uga>Otobi. From the plastic limit results, it can be concluded that the soils expand and contract as the temperature changes. It can be concluded that, the soils are plastic in nature. The waterlogging problem in Owetor may be due to low infiltration capacity of the plastic soil in the area. The erosion menace in parts of Otobi may be partly due to the nature of the soil and partly due to poor management and cultural practice by the people.
Acknowledgements
The authors thank SCC Nigeria Limited for providing facilities for the laboratory analysis.
References
1. Ibeneme S. I., Idiong I. A., Nwagbara J. O., Selemo A. O., Israel H. O., Assessment of the Engineering Significance of Geo-Materials Derived from a Borrow Pit at Ugwu Orlu, South-East Nigeria, International Research Journal of Geology and Mining, 2014, 4(1), p. 1-8.
2. Suma M., George A. V., Rekha V. B., Leenamma J., An Assessment of Soil Properties under Different Landuse Types of the Kallada River Basin, Kerala, India, Environmental Research, Engineering and Management, 2011, 1(55), p. 5-13.
3. Roy S. and Bhalla S. K., Role of Geotechnical Properties of Soil on Civil Engineering Structures, Resources and Environment, 2017, 7(4), p. 103-109.
4. Brady N. C., The nature and properties of soils, 10th Ed. McMillan Publishing Company, New York, 1974, p. 47-101.
5. Arnold K. A., Introduction to Soil Mechanics. (2ndEd), 1986, p. 160-165.
6. Musa J. J., Effect of Domestic Waste Leachates on Quality Parameters of Groundwater, Leonardo Journal of Sciences, 2014, p. 28-38.
7. Ogunkule, Fatoba P. O., Okewole G. A., Mosses as Biomonitors of heavy metal Deposition in the atmosphere, International Journal of Environmental Sciences, 1982, 1(2), p. 44-77.
8. Ebtehaj I., Bonakdari H., No-deposition Sediment Transport in Sewers Using Gene Expression Programming, Journal of Soft Computing in Civil Engineering, 2017, 1(1), p. 29-53.
9. Ankidawa B. A., Discovery of Perched Aquifer when Assessing Aquifer Potential along the floodplain of the Upper Benue River, NE Nigeria, The International Journal of Engineering and Science, 2015, 4(4), p. 11-22.
10. Qazi W. H., Osman S. B. A. S., Memon M. B., Prediction of soil Engineering Properties using electrical Resistivity Values at Controlled Moisture Content-A Conceptual Paper 2016, ARPN Journal of Engineering and Applied Sciences, 2016, 11(6), p. 3684-3689.
11. Census, Population of the Federal Republic of Nigeria, Benue State statistical Tables, National Population Commission Final Results of Population of Nigeria, 2006.
12. Ankidawa B. A., Tanko J. A., Particle size distribution and its effect on hand drilling technique in the River Benue floodplain, North Eastern Nigeria, International Journal of Scientific Research and Innovation Technology, 2015, 2(2), p. 63-77.
13. Ankidawa B. A., Assessing the Sedimentology along River Benue Floodplain for Application using Manual Drilling, North Eastern Nigeria, Journal of Basic and Applied Research, International, 2015, 7(4), p. 211-219.
14. Nwafor G. N., Uduji E. R., Kwache J. B., A compiled Report of Four Giant Mineral Deposits in Benue State, Geological Survey of Nigeria, 1997, pp. 33-36.
15. Agah V. E., Metallic Mineral Exploration in Otukpo Area of Benue State, Published PhD Thesis, 2014, pp. 25-41.
16. Bala K. C., Khan R. H., Characterization of Beach/River Sand for Foundry Application, Leonardo Journal of Sciences, 2013, p. 77-83.
17. SCC., Sogic Construction Company Nigeria Ltd, Laboratory Manual (unpublished document), 2013.
18. Whitlow R., Basic Soil Mechanics, (2nd ed.), John Wiley and Sons, Inc. New York, 1993, pp. 54-55.
19. Arora K. R., Soil Mechanic and Foundation Engineering, Standard Publishers Distributors, Delhi, 2008, pp. 6-10.
20. Youdeowei P. O., Nwankwoala H. O., Preliminary Evaluation of Some Engineering Geological Properties of Soils in the New Yenagoa Town, Bayelsa State, Central Niger Delta, J. Appl. Sci. Environ. Manage, 2012, 16(3), p. 227-231.
21. Kilic K., Kilic S., Kocyigit R., Assessment of Spatial Variability of Soil Properties in Areas Under Different Land Use, Bulgarian Journal of Agricultural Science, 2012, 18(5), p. 722-732.
22. Abdullahi M., Properties of Some Natural Fine Aggregates in Minna, Nigeria and Environs, Leonardo Journal of Sciences, 2006, 5(8), p. 1-6.